Learn how workforce data helps colleges identify why programs fail the Do No Harm earnings benchmark & what institutions can do to improve graduate outcomes.
Education

By Dr. Chris Chmura & Dr. Francesco Renna
Published Jul 14, 2026
Imagine investing $100,000 in the stock market without researching the company. Or buying a home without inspecting the property or considering the neighborhood.
Most major financial decisions are made with as much information as possible because better information leads to better decisions.
Choosing a college major, however, has historically been different.
Students often select programs based on personal interests, recommendations from family and friends, or perceptions about career opportunities. Meanwhile, colleges have traditionally measured demand by student enrollment rather than whether graduates are entering careers with strong labor market demand and competitive wages.
Part of the challenge is information. While labor market data has become much more accessible in recent years, students (and often institutions themselves) haven't always had clear visibility into the occupations, wages, and employer demand associated with a particular academic program.
The Department of Education's new Do No Harm (DNH) policy is designed to reduce that information gap by holding institutions accountable for graduate earnings.
But for colleges and universities, the most important question isn't simply whether a program passes or fails.
It's understanding why.
Some programs fall short because they prepare students for occupations with limited labor market demand. Others fail even though the careers they lead to offer strong wages and abundant job opportunities because graduates never connect with those careers after earning their degree.
Understanding the difference is where workforce intelligence becomes essential.
What the Do No Harm Rule Measures
The Do No Harm policy applies to institutions participating in the federal Direct Loan Program.
Under the final rule, undergraduate programs must demonstrate that graduates earn more than the typical worker with only a high school diploma. Graduate programs must demonstrate earnings above those of individuals with a bachelor's degree.[1]
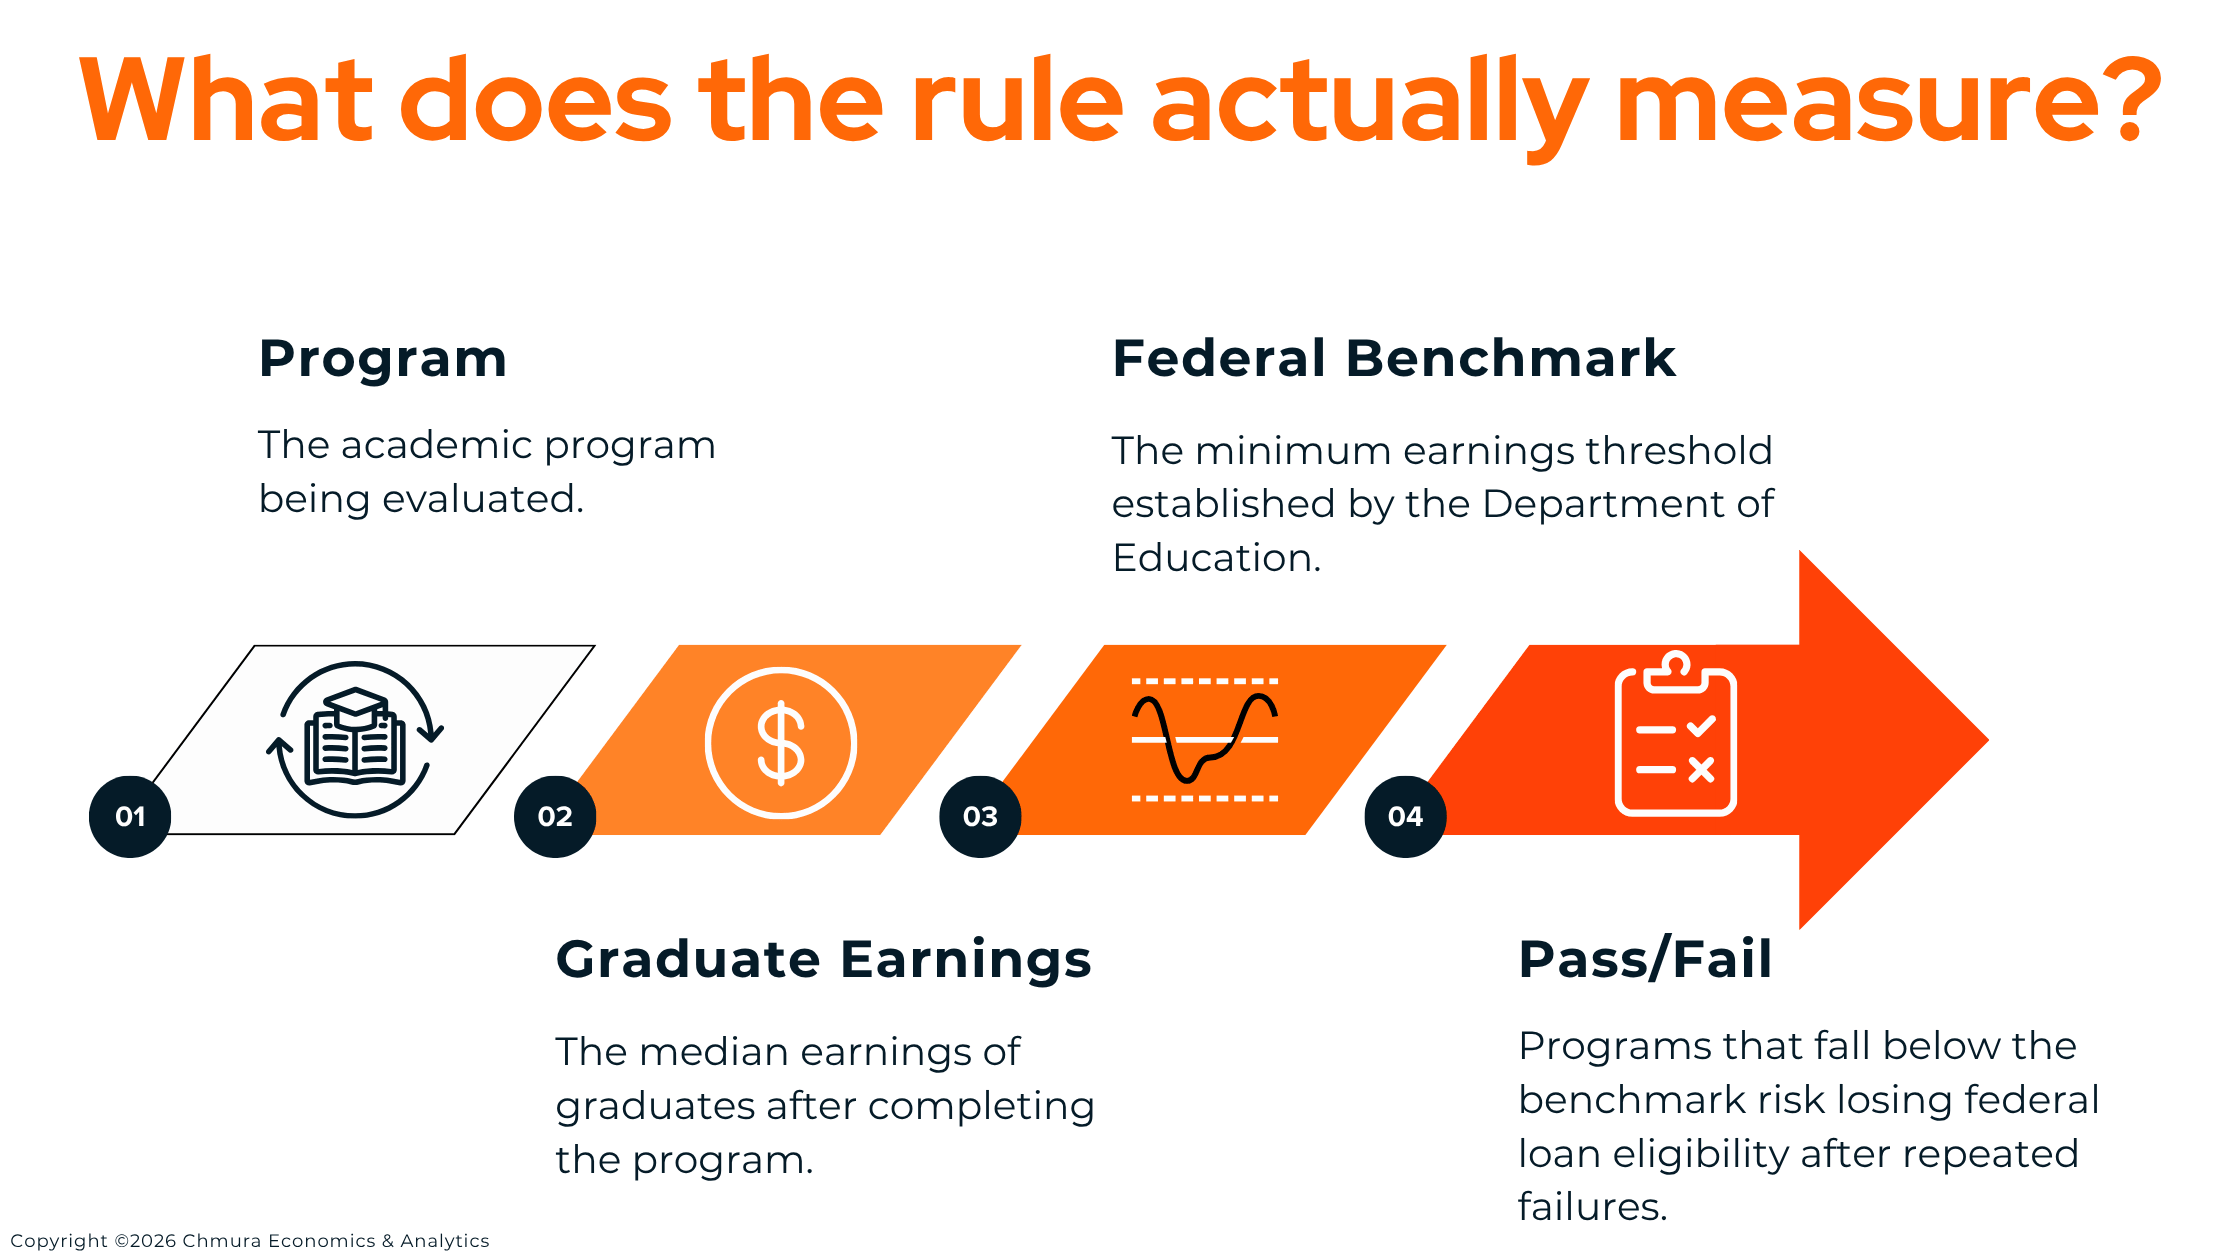
In January 2026, the Department of Education released its 2026 Program Performance Data, providing institution-level information on enrollment, completions, earnings, debt, and other student outcomes. Those data allow institutions to evaluate how their academic programs perform under the new accountability measures.
The Department finalized the rule on July 1, 2026, making clear that programs failing the earnings accountability measure in two of three consecutive years risk losing Direct Loan eligibility and potentially all Title IV funding. 1, [2]
For many institutions, the immediate priority is identifying programs that may be at risk.
The more valuable exercise, however, is understanding what's driving those results.
Looking Beyond the Pass/Fail Result
The Department of Education's data tells institutions which programs may have a problem.
It doesn't explain what the problem is.
A program may produce graduates whose earnings fall below the federal benchmark for very different reasons.
One possibility is that graduates are entering occupations with relatively low wages or limited employer demand. In that case, institutions may need to evaluate curriculum, enrollment, or even long-term program viability.
Another possibility is more encouraging. Graduates may be trained for occupations with strong wages and persistent labor shortages, but many never enter those occupations. The issue isn't labor market demand. It's the connection between students and careers.
Those situations require very different institutional responses, which is why labor market intelligence is such an important complement to the Department of Education's outcome data.
The distinction becomes much clearer when we look at a real example.
A Real-World Example: English Programs in Indiana
Two Indiana institutions offer bachelor's degrees in English Language and Literature/Letters (CIP 23.01).
According to the Department of Education's 2026 Program Performance Data[3] :
• Indiana University Northwest graduates earned a median of $29,768 four years after graduation.• Purdue University Northwest graduates earned $34,560.
Both fell below Indiana's benchmark of $35,051 for high school graduates and therefore failed the earnings accountability measure.
At first glance, this might suggest the programs prepare students for low-paying careers.
But that's not what the labor market data shows.
.png?width=1056&height=594&name=Program%20Performance%20Explorer%20Graphic%20(2).png)
Graduates with Degrees in English Language and Literature Are Well Suited for These Occupations
• Postsecondary English Teachers (SOC 25-1123)
• Elementary Teachers (SOC 25-2021)
• Middle School Teachers (SOC 25-2022)
• Secondary Teachers (SOC 25-2031)
• Editors (SOC 27-3041)
• Technical Writers (SOC 27-3042)
• Writers and Authors (SOC 27-3043)
• Proofreaders (SOC 43-9081)
What Workforce Data Reveals
The average entry-level wage across English-related occupations in Indiana was $46,900[4] —well above the federal earnings benchmark.
Even workers earning at the 25th percentile earned approximately $35,380, still exceeding the benchmark used under the Do No Harm rule.
Employer demand also remains strong.
Many of the occupations associated with English graduates are experiencing workforce shortages, indicating that employers continue to struggle to fill these positions.
In other words, the degree itself isn't necessarily leading students toward low-paying careers.
The labor market suggests graduates should have opportunities to earn above the benchmark.
Potential Average Annual Occupation Gaps Over 10 Years
| SOC | Occupation | Annual Supply Gap | Employment 2025 Q4 | Growth Demand | Sep Demand | Annual Demand | Projected Employment 2035 | Accumulated Supply 2035 | Accumulated Demand 2035 | Avg Wages |
| 25-2021 | Elementary School Teachers, Except Special Ed | -62 | 27,773 | -40 | 1,849 | 1,808 | 27,368 | 14,205 | 14,822 | $61,800 |
| 25-2031 | Secondary School Teachers, Except Special and Career/Techical | -49 | 21,002 | -25 | 1,316 | 1,291 | 20,751 | 10,474 | 10,960 | $68,900 |
| 25-2022 | Middle School Teachers, Except Special and Career/Technical Education | -26 | 11,712 | -17 | 780 | 762 | 11,539 | 5,992 | 6,250 | $63,100 |
| 27-3043 | Writers and Authors | -7 | 1,793 | 7 | 171 | 179 | 1,864 | 1,102 | 1,174 | $71,600 |
| 27-3042 | Technical Writers | -2 | 994 | 2 | 78 | 81 | 1,019 | 662 | 683 | $76,000 |
| 25-1123 | English Language and Literature Teachers, Postsecondary | -1 | 963 | -3 | 68 | 65 | 938 | 526 | 539 | $82,300 |
| 27-3041 | Editors | 1 | 1,445 | 2 | 122 | 124 | 1,464 | 1,012 | 1,004 | $59,100 |
| 43-9081 | Proofreaders and Copy Markers | 3 | 250 | -1 | 39 | 37 | 237 | 264 | 234 | $41,900 |
The Missing Link: Connecting Graduates to Careers
So why did the programs fail?
JobsEQ's Resume Forensics provides another important piece of the story.
Rather than finding graduates working as teachers, editors, writers, or technical communicators, many alumni appear to be employed in positions unrelated to their field of study.
Examples include:
• Administrative Assistant• Customer Service Associate
• Grocery Clerk
• Franchise Owner
• Store Cashier
• Loan Operations Specialist
• Team Coach
While many of these are valuable careers, they generally don't reflect the occupations most directly aligned with an English degree.
This suggests the issue may not be the academic program itself.
Instead, many graduates may not be making the transition into the careers their education prepared them to pursue.
For institutions, that's an important distinction.
A program with strong labor market demand but weak career placement requires a very different strategy than a program preparing students for occupations with limited opportunity.
Purdue University Northwest and Indiana University Northwest English Major Graduates of 2018-2019 Often Obtain Jobs Outside of Their Major Based on 2017-2018 Social Media Profiles
| Job Title | Entry Level Wage | Online Profiles |
| Administrative Assistant | $31,500 | 2 |
| Franchisee | N/A | 2 |
| Loan Operations Specialist | N/A` | 2 |
| Team Coach | $29,600 |
2 |
| Academic Coach | N/A | 1 |
| Admissions Representative | N/A | 1 |
| Assistant Manager | $31,200 |
1 |
| Barista | $24,400 | 1 |
| Bookseller | N/A | 1 |
| Business Owner | N/A | 1 |
| Chemistry Teacher | N/A | 1 |
| Claims Supervisor | N/A | 1 |
| Compliance Analyst | N/A | 1 |
| Copywriting Consultant | $39,100 | 1 |
| Customer Service Associate | $27,400 | 1 |
| Firefighter | $47,400 | 1 |
| Forklift Operator | $35,700 | 1 |
| Grocery Clerk | $30,000 | 1 |
| HUP/Unit Secretary | N/A | 1 |
| Kennel Assistant | N/A | 1 |
| Library Clerk | N/A | 1 |
| Marketing Manager | $66,800 | 1 |
| Marketing Project Coordinator | N/A | 1 |
| National Learning Coordinator | N/A | 1 |
| Optical Manager | N/A | 1 |
| Patient Scheduling Representative | N/A | 1 |
| Prevention Coordinator | N/A | 1 |
| Sales & Service Representative | $54,200 | 1 |
| Senior EDI Specialist | N/A | 1 |
| Software Engineer | $78,400 | 1 |
| Store Cashier | N/A | 1 |
| Strategy & Alignment Supervisor | N/A | 1 |
| Team Lead | $33,800 | 1 |
| Train Reporting Representative | N/A | 1 |
*Source: JobsEQ
Turning Accountability into Opportunity
The Do No Harm rule isn't simply about compliance.
It's an opportunity for institutions to better understand how academic programs connect to workforce outcomes and where interventions can have the greatest impact.
By combining Department of Education outcome data with workforce intelligence from JobsEQ, colleges and universities can answer questions such as:
• Are graduates entering occupations aligned with their education?• Do those occupations offer sufficient wages and employer demand?
• Which programs may need stronger employer partnerships?
• Where could improved career advising increase graduate success?
• Which academic programs truly need redesign, and which simply need better pathways to employment?
For programs where labor market demand is strong but graduate placement is weak, helping students understand career opportunities earlier can make a meaningful difference. Career exploration tools like Career Concourse can connect students with occupations related to their degree, highlight employer demand, and reinforce the value of internships, networking, and career planning long before graduation.
Ultimately, the goal isn't simply to pass a federal benchmark.
It's to ensure students graduate prepared for careers that reflect the value of their education and to give institutions the insight they need to continuously strengthen that connection.
[1] U.S. Department of Education. U.S. Department of Education Issues Final Rule to Hold All Colleges and Universities Accountable for Low-Earning Programs. June 29, 2026.
[2] U.S. Department of Education. Accountability in Higher Education and Access Through Demand-Driven Workforce Pell: Student Tuition and Transparency System (STATS) and Earnings Accountability. Federal Register, July 1, 2026.
[3] U.S. Department of Education. 2026 Program Performance Data.
[4] Computed as the mean of the lower third of all wages in 2025Q4, deflated to 2024 dollars to make it comparable to the DOE rule.