JobsEQ Canvas gives you one workspace to pull the labor market evidence, build the charts and tables, and assemble the Perkins V report behind your CLNA. No exporting, no rebuilding it somewhere else. Included on all JobsEQ licenses.

Meet CLNA Labor Market Requirements
Start from the Perkins V report rather than a blank page, then bring the industry, occupation and postings evidence together in one workspace and build the labor market section of your CLNA there.

Anticipate Future Skill Needs
Shape programs that prepare students for future workforce needs, not out-of-date demands.

Defend Program Decisions With Evidence
Share region-specific labor market intelligence with stakeholders and state reviewers in the format they expect, as a live dashboard or as a PDF. Colleagues can work on the same canvas and comment in place, so the review happens before the submission goes out.





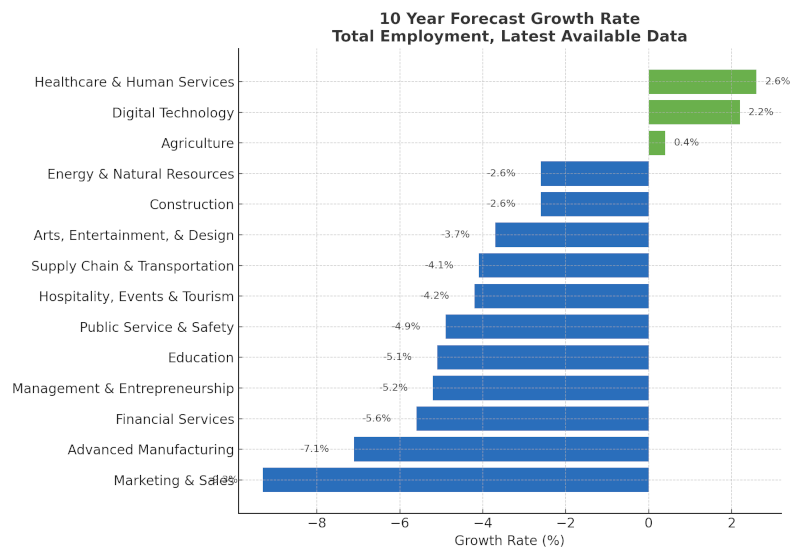
Eliminate Guesswork in Program Alignment
Replace fragmented research with one workspace that combines industry trends, occupation demand, postings data, and education awards, and that you keep working in rather than rebuild each cycle.
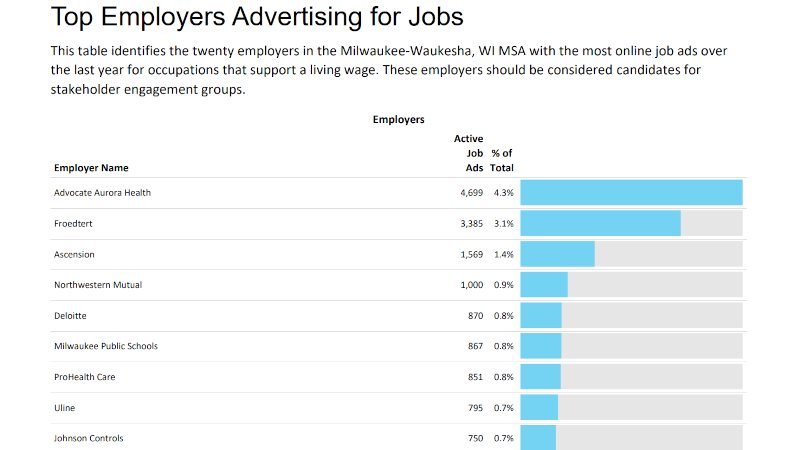
Build Reports That Pass Review With Confidence
Assemble the report and the evidence behind it in the same place, so a reviewer's question can be answered from the workspace it was built in rather than from a folder of exports.
A Complete View of Labor Market Alignment
The Perkins V report brings multiple data sets into one workspace you can keep working in, share with colleagues, or publish as a finished document. The work no longer stops at the download button.

Industry Snapshot
Understand which industries drive your regional economy and where career opportunities are strongest.

Occupation Snapshot
Identify high-demand and high-wage occupations to guide program development.

Job Postings (RTI)
See real-time employer demand for skills and certifications directly from job ads.

Skill and Certification Gaps
Uncover gaps between what employers require and what candidates present so you can adjust curricula accordingly.

Awards Data
Compare program completions with workforce needs to assess alignment and highlight opportunities for growth. Bring your own data alongside JobsEQ's, so your own completions figures sit in the same analysis as the labor market data.
Trusted Data for Perkins V Compliance
JobsEQ data is built on rigorous methods and real-world validation. Each report combines government sources, real-time postings, and proprietary modeling to ensure accuracy and defensibility.
Multi-Source Collection
Labor market intelligence is drawn from job postings, government datasets, and validated economic models, ensuring no gaps in your CLNA.
Transparent and Defensible
Every figure in the Perkins V report is backed by methodology you can explain to stakeholders and auditors. Because the report is built and kept in JobsEQ, the figures and the method behind them stay together instead of drifting apart in exported copies.
Continuous Updates
JobsEQ is updated as soon as new data are available. Next year's CLNA cycle starts from the work you already did rather than from a blank page.