Review 9 workforce metrics that connect HR metrics with hiring pressure, talent supply, pay movement, and workforce risk. Get practical guidance.
Corporate

By Chmura Economics & Analytics
Published Jun 2, 2026
Key Takeaways
-
- Internal HR metrics become more useful when matched with external labor conditions for the same occupation, region, and period.
- Occupation gaps, posting-to-worker ratios, posting velocity, and unemployment provide early warnings of recruiting difficulty.
- Clear thresholds help people analytics teams identify roles that need pay, sourcing, training, or location adjustments.
Strong workforce dashboards connect internal HR performance with the labor conditions surrounding each role and hiring market. That connection helps a CHRO separate an internal execution issue from a talent shortage outside the recruiting team’s control.
Time-to-fill, turnover, and offer acceptance matter, but they need external context. A clear dashboard pairs company results with talent supply, hiring pressure, pay movement, and qualification barriers for the same occupation, region, and period.
CHRO dashboards need metrics tied to workforce decisions
A useful CHRO dashboard helps leaders decide where to hire, what to pay, which roles need deeper planning, and which targets require revision. Each measure should support a clear business question. A company-wide HR metric paired with a single-region labor measure will create a false comparison unless the scope difference is clearly labeled.
The strongest setup uses one occupation, one region, and one reporting period as the basic unit of analysis. A health system reviewing registered nurses in Charlotte should pair its local time-to-fill and offer acceptance figures with Charlotte labor supply, wage movement, posting activity, and projected openings. This structure gives executives a fair comparison and keeps broad averages from hiding risk.
“Strong workforce dashboards connect internal HR performance with the labor conditions surrounding each role and hiring market.”
9 workforce metrics every CHRO should track in 2026
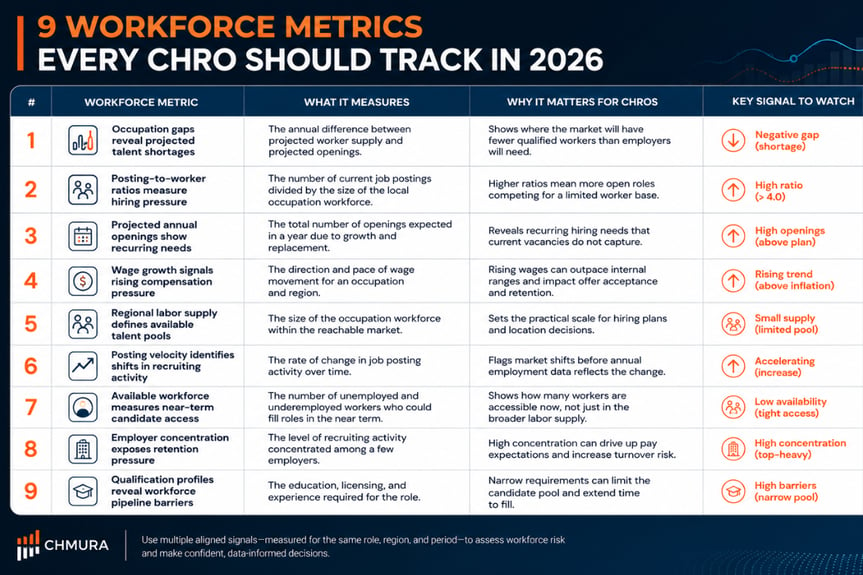
The following workforce metrics cover recruiting difficulty, pay pressure, talent access, and longer-term workforce risk. The JobsEQ dashboard framework treats each signal as part of a connected view rather than standalone proof.
1. Occupation gaps reveal projected talent shortages
An occupation gap estimates the annual difference between worker supply and projected openings. A negative gap signals that the market will produce fewer qualified workers than employers will need. A CHRO planning a large nurse hiring cycle can use that result to test headcount goals before recruiters receive targets. The measure is most useful beside posting activity, unemployment, and regional labor supply because each one adds context to the projected shortfall.
2. Posting-to-worker ratios measure hiring pressure
A posting-to-worker ratio compares current job postings with the size of the local occupation workforce. A high ratio shows that many open roles are competing for a limited worker base. Two regions can report the same number of software developer postings while presenting very different hiring conditions because their workforce sizes differ. This ratio gives talent leaders a fairer market comparison and helps explain why identical recruiting plans produce different results.
3. Projected annual openings show recurring hiring needs
Projected annual openings estimate how many workers employers will need because of growth and replacement hiring. The figure helps a CHRO see recurring pressure that a current vacancy count will miss. A manufacturing team may have few open machinist roles today while projected openings show a much larger annual need across the region. That difference supports earlier training partnerships, internal mobility plans, and more realistic workforce budgets.
4. Wage growth signals rising compensation pressure
Wage growth shows the direction and pace of pay movement for an occupation and region. Sustained increases can signal that employers are paying more to secure scarce talent. A flat internal salary range beside rising market wages will place offer acceptance and retention at risk. CHROs should review wage growth with advertised pay and employer activity, since one figure alone cannot explain every pay issue.
5. Regional labor supply defines available talent pools
Regional labor supply measures the size of the occupation workforce within the market you can reasonably reach. Headcount alone will not show how many workers are available, yet it sets the scale for every hiring plan. A region with 8,000 accountants can support a different expansion plan than one with 800. Labor supply also helps leaders compare potential locations before approving hiring goals or office growth.
6. Posting velocity identifies shifts in recruiting activity
Posting velocity tracks how quickly job posting activity rises or falls. It can reveal tightening conditions before annual employment measures reflect the shift. A sudden increase in industrial mechanic postings across several employers suggests that recruiters will face more pressure during the next hiring cycle. CHROs can use the signal to adjust sourcing plans, review pay ranges, and brief operating leaders before delays appear in internal HR metrics.
7. Available workforce measures near-term candidate access
Available workforce measures focus on unemployed and underemployed workers who could enter a role sooner than the broader labor supply. A large occupation base with very low unemployment can still offer a small near-term candidate pool. A hiring team that needs accountants within 60 days should examine accessible workers rather than assume the full occupation workforce is reachable. This measure keeps recruiting plans grounded in near-term availability.
8. Employer concentration exposes retention pressure
Employer concentration shows who hires the same workers and how much recruiting activity sits with a small group of firms. A dominant employer can raise pay expectations or pull talent from nearby organizations at scale. Healthcare leaders assessing nurse turnover should identify the employers posting most often and the salary ranges they advertise. That context helps separate manager-level retention issues from wider market pressure.
9. Qualification profiles reveal workforce pipeline barriers
Education and experience profiles show how narrow the qualified candidate pool will be and how long replacement workers will take to prepare. Licenses, degrees, and experience thresholds can create delays even when the broader labor supply looks adequate. A role requiring a specific credential and several years of experience cannot rely on entry-level hiring alone. CHROs can use this measure to test job requirements and set build-versus-buy plans.
|
Workforce metric |
What it tells leaders |
|
Occupation gaps reveal projected talent shortages |
This measure shows when projected worker supply will fall short of recurring hiring needs. |
|
Posting-to-worker ratios measure hiring pressure |
This ratio places current recruiting activity against the size of the local workforce. |
|
Projected annual openings show recurring hiring needs |
This forecast captures hiring caused by growth and worker replacement. |
|
Wage growth signals rising compensation pressure |
This measure shows when market pay is moving beyond current salary assumptions. |
|
Regional labor supply defines available talent pools |
This figure sets the practical scale of each hiring market. |
|
Posting velocity identifies shifts in recruiting activity |
This measure flags market movement before annual employment figures catch up. |
|
Available workforce measures near-term candidate access |
This view estimates how many workers could be reachable soon. |
|
Employer concentration exposes retention pressure |
This measure identifies the firms most likely to affect recruiting and retention. |
|
Qualification profiles reveal workforce pipeline barriers |
This profile shows how credentials and experience narrow the candidate pool. |
How CHROs should prioritize workforce risk signals
“Strong judgment comes from several aligned signals measured for the same role, region, and period.”
No single workforce metric should trigger a major plan revision. A negative occupation gap, high posting-to-worker ratio, low unemployment, rising wages, faster posting velocity, or projected openings above available workforce all strengthen the case for action.
The Chmura framework assigns high risk when at least three conditions are present and a watch status when two are present. That rule gives people analytics teams a repeatable standard for executive dashboards while preserving room for operating context. Disciplined scope, consistent definitions, and clear thresholds will produce workforce plans that leaders can explain and defend.