Discover why a retail gap doesn’t always signal opportunity and how market feasibility analysis can reveal demand, competition, and site viability.
Economic Development

By Patrick Clapp
Published Sep 4, 2026
A neighborhood without a grocery store can look like an obvious market opportunity.
But residents do not limit their shopping to neighborhood boundaries. They cross rivers, city limits, and county lines. A location that appears underserved on a map may already be part of a highly competitive regional market.
Nearby stores also differ in how well they serve local households. Income, vehicle availability, and transportation all affect access. The U.S. Department of Agriculture incorporates these factors into its measures of low-income, low-access areas, often called food deserts.[1]
That makes grocery location strategy more complicated than finding an empty spot. A feasibility study also needs to ask how households currently shop, which stores already compete for their spending, and whether a new concept can capture enough demand to support its operations.
Case Study: Grocery Competition in Manchester within Richmond City, Virginia
Consider Manchester, located just south of downtown Richmond and across the James River.
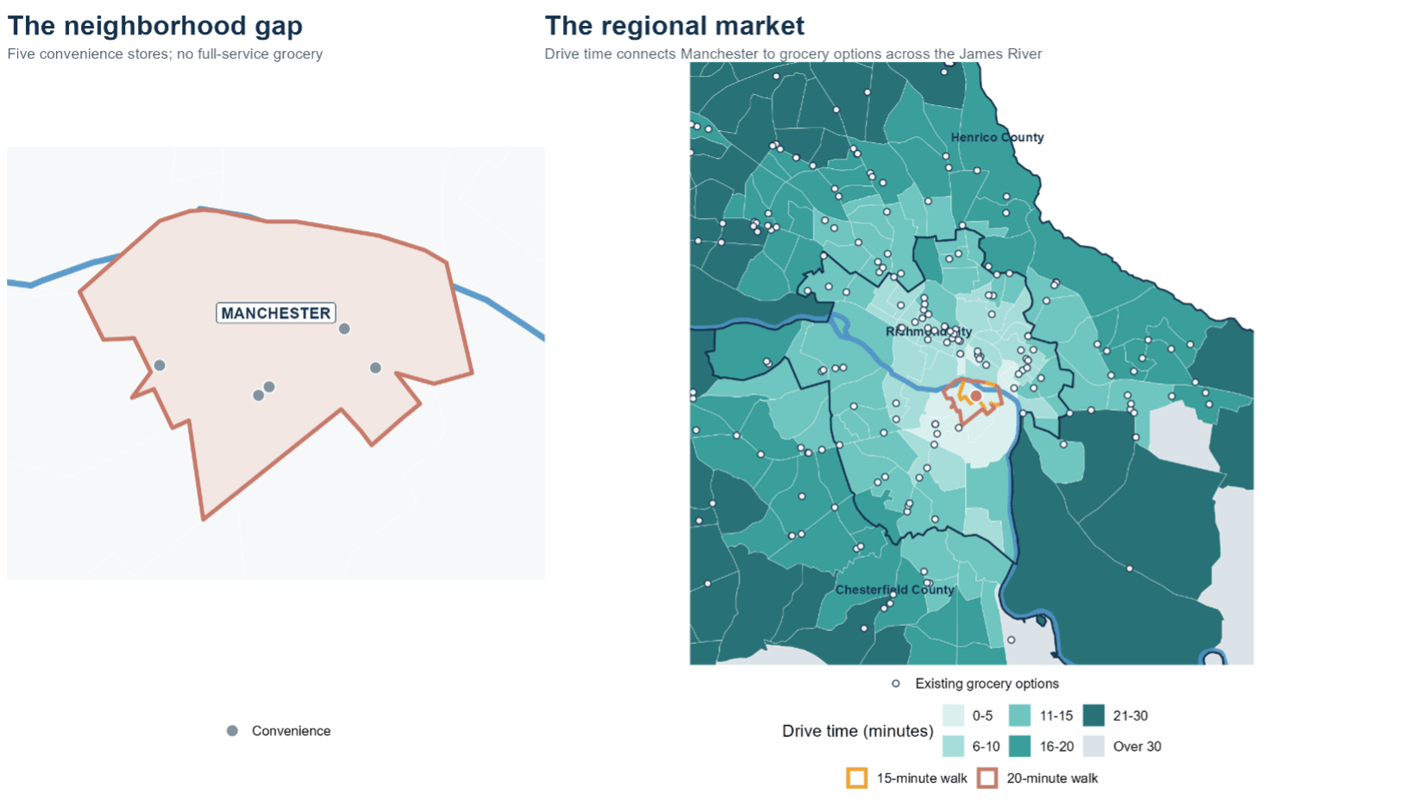
The outlined study area contains five convenience stores but no full-service grocery. Up close, Manchester looks like a clear gap in the grocery market.
The regional view tells a more complicated story. Roads and bridges connect Manchester to grocery stores throughout Richmond, Henrico, and Chesterfield.
Manchester’s grocery gap reflects limited walkable access, not a lack of regional competition. Residents can reach numerous established grocers by car, leaving a proposed full-service store with less capturable spending than the format would need to support its operations. The map pairs the larger driving market with the much smaller area that residents can reach on foot.
Manchester sits within a growing regional market, so the issue is not simply a lack of population or growth. In 2026, Richmond ranked second on LinkedIn’s U.S. Cities on the Rise list, which considers job opportunities and growth in workforce talent.[2] The harder question is how much local spending a new store could realistically capture from established competitors.
About 56,400 households live within a ten-minute drive of the Manchester reference location.
For households with a vehicle, the market extends well beyond Manchester. Bridges connect residents to a broad field of existing stores on both sides of the James River.
Walking produces a much smaller accessible market. The road and pedestrian network places about 3,650 residents within a modeled 15-minute walk and roughly 6,900 within 20 minutes of a representative location near the center of the Manchester study area.
About 8,300 households within the ten-minute driving market—nearly 15%—do not have a vehicle. For those households, regional proximity may not translate into practical access.
Households with cars may also value a closer option as part of a walkable mix of neighborhood services. Vehicle availability identifies the clearest access constraint, while the walk-time analysis captures the broader convenience of reaching groceries on foot.
Based on these factors, Manchester has a local access gap, but not a pool of unclaimed grocery spending. Households already purchase groceries somewhere; the feasibility question is how much of that spending a Manchester store could redirect from existing competitors.
Chmura estimated grocery demand by grouping households by income and applying income-specific food-spending shares. The calculation separates food-at-home purchases from spending at restaurants and other food-service businesses. It produces about $331 million in annual grocery demand within a ten-minute drive of Manchester.
$331 million sounds like a substantial retail opportunity. But total spending in a trade area is not the same as spending available to a new entrant. Much of that demand is already being captured by existing stores.
The competitive model distributes that household spending among accessible stores based on network travel time, store format, and estimated store capacity. Adding a hypothetical large full-service grocery in Manchester shows how much spending the new location could draw and how much existing competitors would retain.[3]
A New Manchester Store Would Mostly Redistribute Existing Grocery Spending
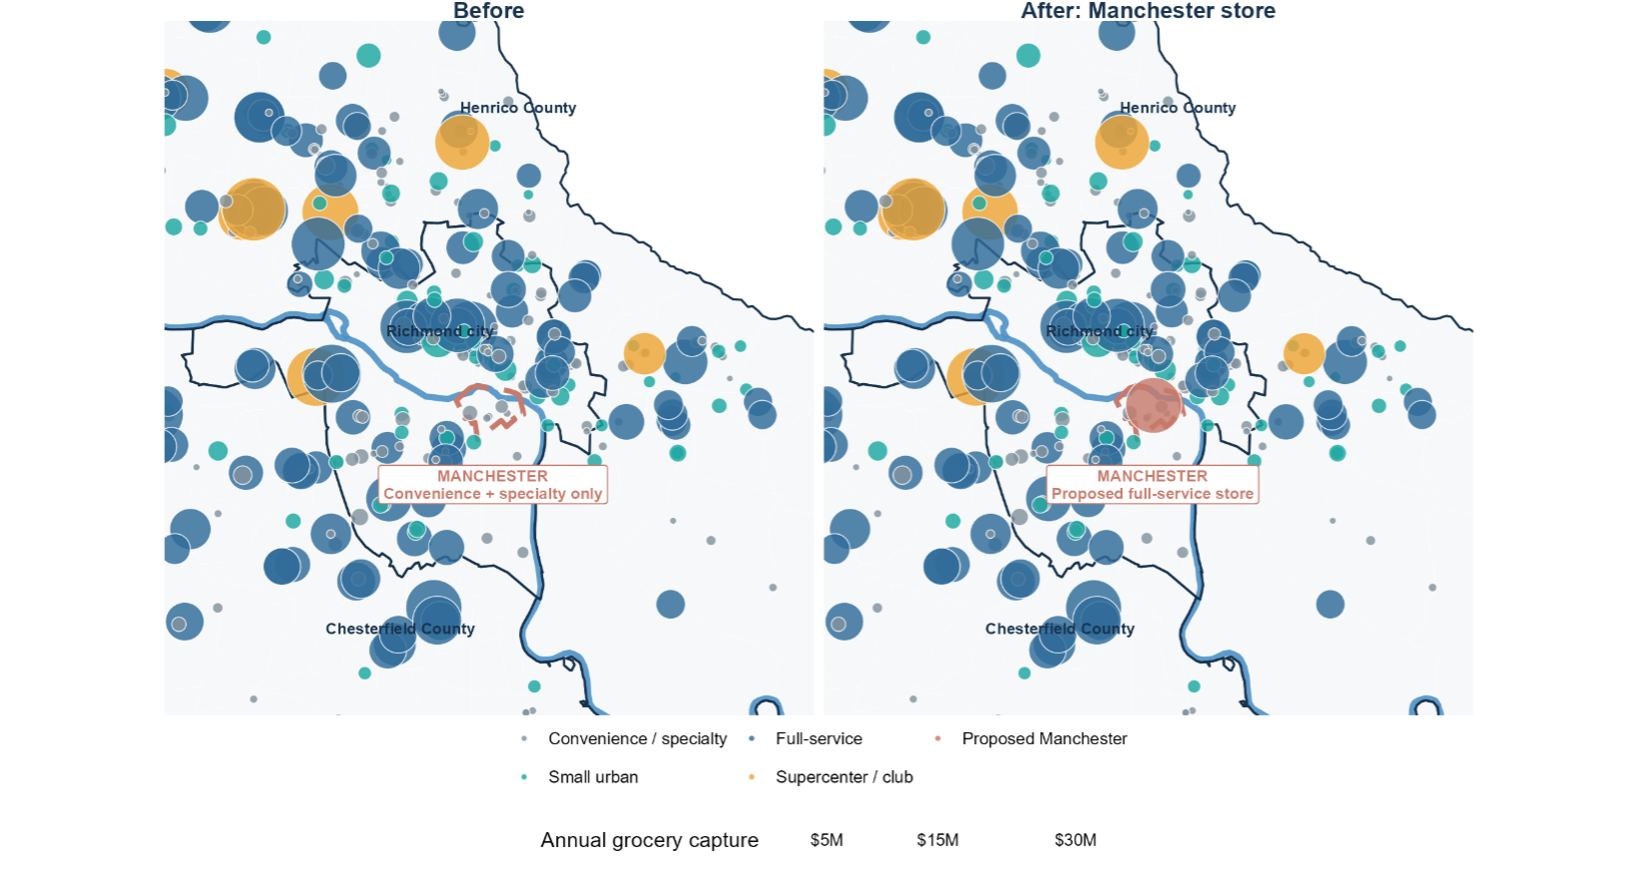
Bubble size shows modeled market capture, while color distinguishes the store format. Using the same scale in both panels shows how spending shifts when the Manchester store enters.
Of the approximately $331 million household spending on food at home within that ten-minute market, a large Manchester grocery captures about $14.2 million, or 4.3%. It draws another $14.7 million in smaller shares from households farther away, bringing total modeled capture to $28.9 million.
Competition explains the limited share. Thirty primary grocers already operate within a ten-minute drive, including one about four minutes from the test site. Although Manchester lacks a full-service store inside the neighborhood, many nearby households still find an established competitor more convenient or attractive.
The new store would also take some grocery spending from Manchester’s convenience stores, but most of its capture would shift from existing supermarkets that currently serve residents’ larger shopping trips. Convenience stores remain better positioned for quick purchases, walkable access, extended hours, and products outside the model’s food-at-home spending pool.
In other words, Manchester lacks a full-service grocery within the neighborhood, but its households already participate in a crowded regional grocery market.
A Broader View of Retail Market Competition
Store format also matters.
The analysis compares three concepts: a small urban grocery of roughly 8,000 to 20,000 square feet, a standard full-service store of 30,000 to 50,000 square feet, and a large full-service store of 50,000 to 80,000 square feet. Each format has a different competitive reach and annual sales threshold.[4]
Tested Formats Fall Short of the Support Threshold
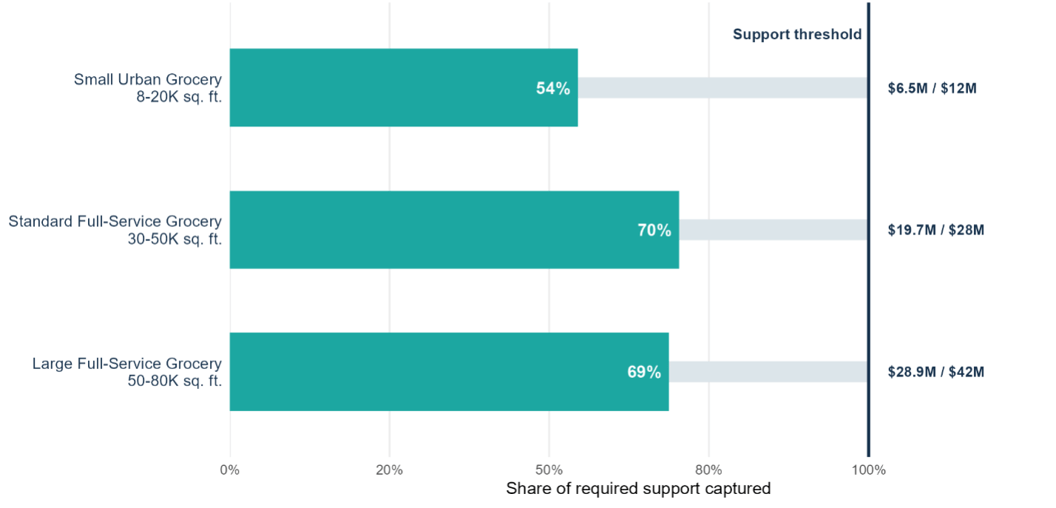
None reaches its assumed benchmark. The small urban concept captures $6.5 million, or 54% of its support requirement. The standard store reaches 70%, while the large store reaches 69%.
Simply reducing the size of a conventional store does not solve the market constraint. A viable concept would need to change the competitive equation. The result does not mean grocery retail cannot work in Manchester. It changes the question from “Is there room for a grocery store?” to “What kind of grocery concept could compete successfully here?”
The food retailers that open and remain in neighborhoods like Manchester may compete differently. A successful operator might emphasize convenience, serve a specialized customer base, carry a distinct merchandise mix, or operate with a lower sales threshold. Those differences can change both the store’s draw and the amount of demand it needs.
The same principle applies beyond grocery stores. A visible gap does not identify which format, service model, or scale is best suited to fill it.
Better Location Decisions Require Better Market Intelligence
Market feasibility requires more than population counts and distance rings.
For this example, household income patterns inform grocery demand. JobsEQ establishment and employment data define the competitive landscape and the relative capacity of existing stores. Network travel times account for roads, bridges, and the James River. The model estimates how accessible stores divide household spending and how a new concept changes that distribution.
The takeaway for economic developers, planners, and businesses is simple: an apparent gap in the market is not necessarily an opportunity and overlooking the competitive dynamics behind that gap can lead to costly decisions.
Before recruiting a retailer, investing in a site, or advancing a redevelopment plan, decision-makers need to understand not just how much demand exists, but where that spending goes today, how existing businesses compete for it, and what type of concept could realistically succeed.
Chmura’s consulting team helps organizations answer those questions. We can apply this framework to retail recruitment, redevelopment and master planning, site selection, and other location decisions – comparing candidate sites, testing alternative concepts, evaluating competitive pressure, and identifying the conditions under which a project becomes feasible. JobsEQ data can extend the analysis to the operating side of the decision, including workforce availability, wages, occupational requirements, and competing employers.
If you’re evaluating a location, recruiting a business, or trying to understand whether a perceived market gap represents a viable opportunity, Chmura can help you move from assumptions to evidence. Contact our consulting team to discuss your project.
Because when households cross neighborhood and jurisdictional boundaries to shop, market analysis needs to cross them too.
[3] Results are illustrative and depend on assumptions about store format, capacity, consumer spending, and competitive draw; a project-specific feasibility study would refine these inputs for a particular operator and site.
[4] Chmura translated representative store sizes into annual sales benchmarks using approximately $600 in annual sales per square foot, based on public grocery-company sales and store-area data. This produces benchmarks of approximately $12 million, $28 million, and $42 million as store size increases.