See how 3 Texas metros rank for renewable energy jobs and get practical insight into workforce fit, payroll, skills, and hiring risk across each market.
Economic Development
Site Selection

By Chmura Economics & Analytics
Published Jul 2, 2026
Key Takeaways
- San Antonio ranks first because it combines strong worker availability, high wind industry concentration, moderate living costs, and the lowest modeled payroll among the three leaders.
- Houston offers the strongest immediate labor availability, though higher payroll and turnover create added hiring and retention pressure.
- Dallas provides a large, educated talent pool for professional and technical roles, but specialized wind positions will require more training or wider recruitment.
Wind is free, but finding the people who can build and run a wind farm is not. Chmura’s LaborEQ analysis ranks San Antonio, Houston, and Dallas as the strongest metropolitan areas for the workforce side of a wind project. The ranking does not measure wind quality. It shows where a project is more likely to find the skills, labor pool, and cost structure needed to operate.
A technically suitable site can still face costly delays when key roles are hard to fill. Wind turbine technicians are only part of the staffing picture. Developers also need electricians, engineers, construction supervisors, logistics staff, managers, and other support workers. Workforce fit shows where those workers are easier to find and where recruitment or training will require more effort.
Workforce fit shapes successful wind farm location choices
Workforce fit measures how well a local labor market lines up with the people a wind farm will need. The LaborEQ model compares 387 metropolitan areas across worker availability, training, age, education, payroll, living costs, turnover, unionization, regional growth, industry concentration, location quotient, and supply-chain presence. The overall rank combines those measures, so a metro can finish near the top while still having clear weaknesses.
The scores need some translation. A labor availability score of 0.743 is not a 74.3% grade, and an education score of 2.391 is not a rating out of five. These are comparative model values. Higher scores generally signal a stronger position for worker availability, training, education, growth, and industry presence. Lower payroll and turnover figures generally point to lower hiring pressure and operating cost.
Location quotient has a clearer benchmark. A score of 1.0 means an industry has the same local employment concentration as the nation. A score above 1.0 shows a larger local concentration. San Antonio’s 24.81 is exceptional, while Dallas’s 1.33 still places the industry 33% above the national level.
“Wind is free, but finding the people who can build and run a wind farm is not.”
3 locations with strong wind farm workforce conditions
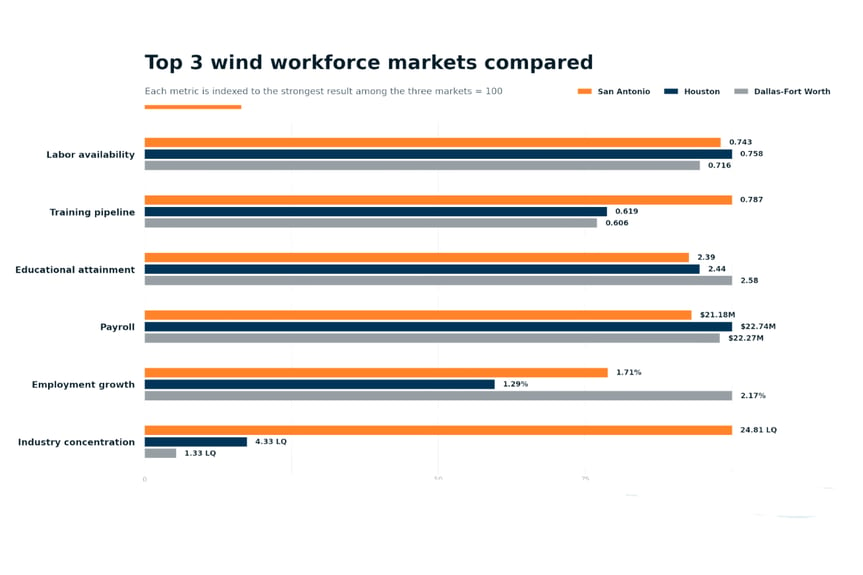
The three leaders reach the top for different reasons. San Antonio has the best balance, Houston has the deepest immediate labor pool, and Dallas offers broad professional and technical capacity. The scores work best as comparison points rather than pass or fail grades.
|
Location |
Main takeaway |
|
San Antonio offers the strongest overall workforce balance |
San Antonio pairs elite labor availability with high industry concentration and the lowest modeled payroll among the three leaders. |
|
Houston combines labor availability with industry depth |
Houston has the strongest labor availability score in the dataset, though higher payroll and turnover add hiring pressure. |
|
Dallas supports scale through a broad talent base |
Dallas combines excellent labor availability with the strongest education score and employment growth among the three leaders. |
1. San Antonio offers the strongest overall workforce balance
San Antonio ranks first because it performs well across several measures instead of relying on one standout number. Its labor availability score of 0.743 ranks second among the 387 metropolitan areas with reported values. Put simply, that score is very good. The model sees an unusually strong pool of workers whose skills overlap with the staffing needs of a wind electric power operation.
Its location quotient of 24.81 is also the second-highest in the dataset. That points to a large concentration of local industry experience. San Antonio also has the lowest modeled payroll of the top three at $21.18 million, and its cost of living falls between 90% and 95% of the national level.
The weaker scores prevent an easy answer. Its training pipeline sits well below the middle of the dataset, and its supply-chain measure is near the bottom. San Antonio is strongest for available workers, industry experience, and lower labor cost. A project will still need to verify local vendors and long-term training capacity.
2. Houston combines labor availability with industry depth
Houston’s clearest advantage is labor availability. Its score of 0.758 ranks first across all 387 metropolitan areas with reported values. That makes it the strongest worker-access score in the dataset. It does not guarantee an easy hire for every role, but it gives recruitment teams the broadest starting pool.
Houston’s location quotient of 4.33 is another positive signal. Wind electric power generation is more than four times as concentrated locally as it is across the nation. Population growth of about 1.5% also supports the size of the labor pool.
Cost is the main tradeoff. Houston has the highest modeled payroll among the three leaders at $22.74 million, along with the highest turnover figure. Its training pipeline and supply-chain scores are also weak relative to many other metros. Houston fits projects that place immediate worker access and energy-sector experience above lower payroll and retention risk.
3. Dallas supports scale through a broad talent base
Dallas ranks third, but its labor availability is still excellent. Its score of 0.716 is the third-highest in the dataset, directly behind Houston and San Antonio. Dallas also posts the strongest educational attainment score of the top three at 2.58. That gives the metro a strong base for professional and technical roles.
Employment growth is another advantage. Dallas records 2.17% growth, compared with 1.71% in San Antonio and 1.29% in Houston. Its location quotient of 1.33 is far lower than the other two leaders, yet it remains above the national benchmark. Wind-specific experience is present, but less concentrated.
Dallas carries a modeled payroll of $22.27 million and the highest cost-of-living range of the group at 95% to 100% of the national level. Its training pipeline score is also the weakest of the three. Dallas makes the most sense when a project needs a large, educated metro workforce and can support added training or wider recruitment for specialized roles.
How to compare workforce fit before selecting a site
The ranking narrows the field, but the final choice should follow the roles that carry the greatest hiring risk. A project that needs many experienced technicians will read the results differently from one that needs more engineers, managers, and construction specialists. The staffing plan should set the priorities because each project uses a different mix of skills.
“The right metro is the one that reduces the hardest workforce risk before hiring begins.”
San Antonio is the clearest choice for balanced workforce conditions and lower modeled payroll. Houston is strongest when immediate access to qualified workers carries the most weight. Dallas offers the broadest fit for professional and technical hiring, with more effort required to build wind-specific skills. Each metro solves a different workforce problem.
The practical payoff is fewer surprises after a site moves forward. A poor workforce match can raise pay, lengthen recruitment, increase training needs, and place more pressure on the project schedule. Chmura’s LaborEQ ranking gives teams a useful first screen, while occupation-level comparisons and labor-shed analysis show how each market will perform for the actual staffing plan.