This week, we’re launching JobsEQ Canvas. We’ve been building JobsEQ for a long time, and during that time, the basic model for analytical software has been remarkably consistent. You explore data, run analyses, compare places, industries, occupations, and other measures in JobsEQ. But when it’s time to bring multiple analyses together, incorporate your own data, add narrative and context, or create something to share with others, parts of that work often move to Excel, PowerPoint, dashboards, reports, or other tools. That model has served analysts well, and we expect that it will continue to.
Our users know JobsEQ already does analysis. But now, Canvas expands what users can build and communicate within JobsEQ.
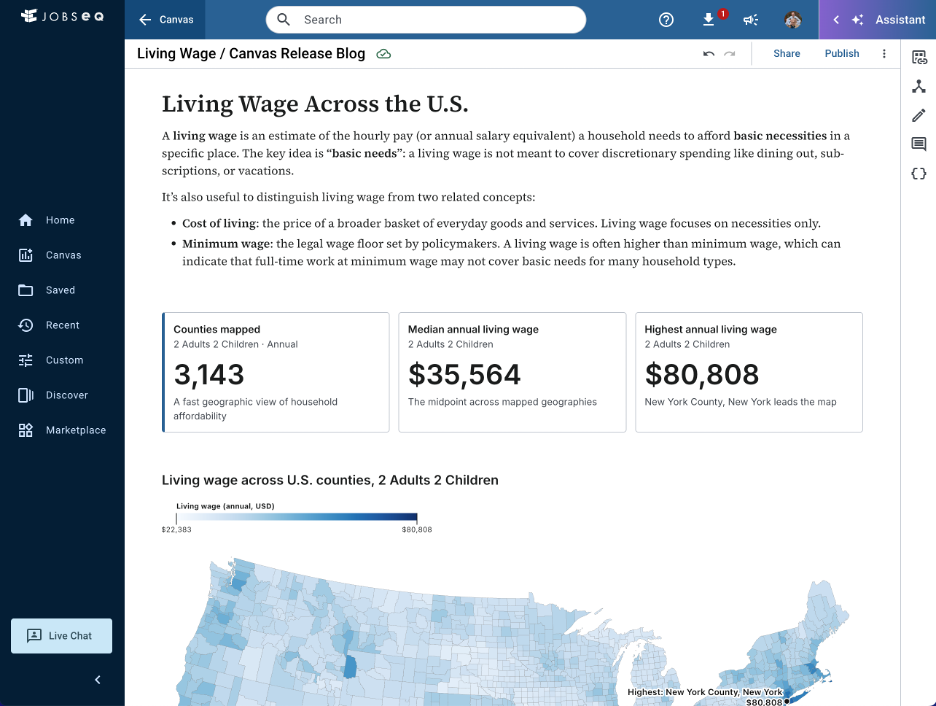
With Canvas, you can bring JobsEQ data, your own data, charts, calculations, narrative, and analysis into a single workspace—then use AI to help build, refine, explain, and communicate the work.
AI is beginning to change what’s possible—it’s changing how people interact with analytical software. Instead of relying entirely on predefined screens, reports, and workflows, we can increasingly describe what we’re trying to accomplish and work with AI to help build, refine, and explore the analysis.
That raises an interesting question for anyone building analytical software:
What should the application look like when AI becomes an active participant in the work?
For us, the answer couldn’t simply be a chatbot added to the side of the existing application. We wanted to build a workspace designed around this new way of working.
That became JobsEQ Canvas.
To be clear, Canvas is first and foremost a feature for our users, not an excuse to build another flashy AI feature. It is designed to make the work of analyzing, combining, communicating, and sharing data more flexible and more useful, whether AI is involved or not.
An AI-Native Workspace for Labor Market Analysis
Canvas started with a fairly simple question:
What would we build today, knowing that people and AI are increasingly going to work together on analysis?
The answer wasn’t another report. It was a workspace.
A JobsEQ Canvas can bring together JobsEQ data, your own data, calculations, tables, charts, narrative, and other analytical content in one place. That matters for users, but it also matters for AI.
Instead of an assistant operating at the edge of the application, Canvas creates an environment where the analysis itself can be assembled, changed, explained, and refined. The user and the AI are working on the same thing.
That is a fundamentally different model.
*Note, this video has been sped up for viewing purposes.
More Than Access to Data
As data become easier to access across platforms, the challenge increasingly shifts from simply obtaining data to turning it into useful analysis. Under that model, the value proposition is essentially: we’ll give you the data wherever you want it.
Put it in your data warehouse. Connect it to your BI platform. Feed it into your AI tools. Build whatever you want.
There is real value in making data accessible and portable. We believe in that too. But I don’t think access to data is the end of the story. Because once the data arrives, someone still has to turn it into something. Someone has to understand it, structure the analysis, choose the right comparisons, build the visualization, add context, validate the result, and ultimately turn it into something another person can use to make a decision.
Our goal isn’t simply to deliver labor market data and leave you to assemble the rest.
We want JobsEQ to help with the work that happens around the data. Canvas is an important step in that direction.
Keeping Analysis and Communication Together
For years, analytical workflows have naturally moved between specialized tools. You might explore something in JobsEQ, take it into Excel for additional analysis, put a chart into PowerPoint, or combine several sources into a dashboard.
Those tools aren’t going away, nor should they. Canvas gives you another option: keep more of that process together.
You can explore the data, build the analysis, add context, and turn it into something that can be shared or published without separating the final artifact from the environment where the analysis happened.
That might be a regional economic profile, a workforce strategy, a site-selection analysis, a compensation study, an industry dashboard, a board presentation, a public-facing data story, or something we haven’t thought of yet.
That last category is the most interesting one.
We Deliberately Did Not Build Another Collection of Reports
One of the questions we’ve traditionally asked when developing JobsEQ is:
What analysis should we build next?
Canvas lets us add another question:
What capabilities can we give users, and AI, so they can create the analysis they need?
That’s a subtle but important change.
We can still build great purpose-built analytics. But alongside them, we can provide reusable analytical building blocks that can be composed in entirely new ways. Increasingly, AI can help with that composition.
That is where we believe analytical software is heading.
Not simply toward a world where every application has a chatbot. And not toward a world where the application disappears and becomes little more than a source of raw data for other tools.
We think there’s a much more interesting place in between:
software where the data, the analytical capabilities, the domain expertise, the user, and AI all work together in the same environment.
Canvas gives us a foundation for that future.
It Changes How We Think About JobsEQ, Too
One of the most interesting outcomes of building Canvas has been how much it has influenced our thinking about JobsEQ as a whole.
JobsEQ has always brought together labor market data, analytics, and the tools to turn that information into meaningful, actionable insights. Canvas gives us a way to extend that idea.
You may have seen us use the phrase, “Let us be your research partner.” Canvas, together with the JobsEQ AI Assistant, gives that idea new meaning. The goal isn’t simply to give you another tool to operate or another source of data to work with. It’s to give you a research partner that can help you explore a question, build the analysis, refine it, and turn what you learn into something useful.
This Is Version One
There is a lot more we want to do with Canvas. Some of it is already underway. Some of it will come from watching how our customers use it. And some of it, I suspect, we haven’t imagined yet.
That’s exactly what makes this launch exciting.
We aren’t just releasing a new feature. We’re introducing a new way of working with JobsEQ data, while laying some important groundwork for what an AI-native JobsEQ can become.
JobsEQ Canvas launches this week. We can’t wait to see what people build with it.