Get practical insight into women in the labor force, participation trends, caregiving pressure, and workforce planning needs in 2026.
Data
Economy
JobsEQ
Trends

 By Former Chmura Staff
Key Takeaways
-
Women’s labor force participation has recovered unevenly, with prime-age women showing strong attachment while total participation still trails February 2020.
-
Caregiving costs, schedule rigidity, wages, and local job access explain more about workforce strain than headline participation rates alone.
-
Employers, educators, workforce boards, and economic developers need local labor market data to turn participation trends into defensible workforce plans.
Women are not leaving work in one simple wave. The better reading is that participation has recovered in important places, while family care costs, schedule rigidity, regional gaps, and employer practices still decide who can stay attached to paid work. The broad labor force participation rate for women ages 16 and over was 56.9% in May 2026, according to the Bureau of Labor Statistics, which shows a labor market that looks steady at the top line but still requires closer analysis.
Chmura data shows the same tension. Women ages 16 and over had a 58.0% labor force participation rate in February 2020, fell to 54.6% in April 2020, and reached 56.9% in May 2026. Prime-age women, ages 25 to 54, tell a stronger story of attachment: their rate moved from 76.9% in February 2020 to 78.2% in May 2026. The question for employers, workforce boards, educators, and economic development teams is no longer only why women leave. It is where the labor market is making continued participation harder than it needs to be.
Women’s participation data points to pressure beneath recovery
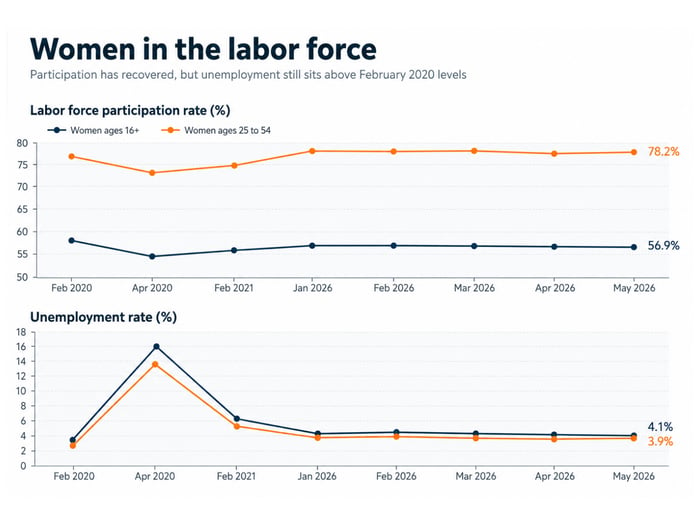
Women’s labor force participation has partly recovered from the sharp early pandemic drop, but recovery does not mean pressure has disappeared. The key issue is that the total participation rate for women remains below its February 2020 level, even while prime-age women are participating at a higher rate than they were before the shock.
That distinction matters for anyone preparing a workforce snapshot or labor market brief. A regional employer could see stable hiring numbers and assume its labor pool has healed. A workforce board could see unemployment near a manageable level and miss the households still constrained by care schedules. A college could assess program interest without checking whether adult learners can actually commit to training hours.
Chmura’s data shows women ages 16 and over at 56.9% participation in May 2026, compared with 58.0% in February 2020. The unemployment rate for women ages 16 and over was 4.1% in May 2026, compared with 3.5% in February 2020. Those figures point to a labor market that has improved, but not returned to the same balance. A defensible workforce plan will separate recovery from readiness.
Prime-age women remain attached to work despite higher strain
Prime-age women show the strongest attachment to paid work. Their participation rate was 78.2% in May 2026, above the 76.9% rate recorded in February 2020. That tells employers and planners that many women in their core working years are still choosing work, even while facing higher costs, schedule pressure, and care responsibilities.
A hospital planning clinical hiring can use this distinction to avoid a broad assumption that women have pulled back from work. A better question is which occupations, shifts, commute patterns, and wage levels support continued participation. The answer will differ between nursing assistants, accountants, teachers, logistics coordinators, and software roles.
The unemployment data adds another layer. Prime-age women had a 3.9% unemployment rate in May 2026, compared with 3.0% in February 2020. Higher participation alongside higher unemployment suggests that more women are still in the labor force, but not all are finding work that fits their skills, schedules, or pay needs. For employers, that creates an opening. Jobs that align pay, scheduling, and advancement with local labor realities will reach workers who are already attached to work but still sorting through imperfect options.
“Women are not leaving work in one simple wave.”
Caregiving costs explain many exits from paid work
Caregiving costs turn labor force participation from an individual preference into a household math problem. When child care is expensive, unreliable, or misaligned with work schedules, women will reduce hours, reject roles, or leave paid work even when they want employment.
The St. Louis Fed reported that child care employment was about 6% below its pre-pandemic level as of February 2023, while the cost of child care was up 14%. Those figures matter because availability and price work together. A parent cannot accept a 7 a.m. shift if care opens at 8 a.m. A worker cannot stay in a lower-wage job if care consumes the gain from working more hours.
The practical lesson is that retention strategies have to account for family logistics. A city workforce agency evaluating labor supply for a new employer should look beyond worker counts and ask what support systems make work feasible. An employer reviewing turnover should compare exits across shift types, job sites, pay bands, and roles with limited flexibility. Caregiving does not remove women from the labor market in one uniform way. It creates pressure points that show up differently across jobs.
Flexibility has become a core retention requirement
Flexibility is no longer a side benefit for many women workers. It is a retention condition that affects attendance, job acceptance, advancement, and the ability to remain in the labor force. Employers that treat flexibility as only remote work will miss the more practical scheduling issues that shape daily work.
A manufacturing employer might not be able to make every role remote, but it can review shift start times, notice periods, swap policies, and part-time pathways. A public agency can assess whether training programs offer evening options. A college can structure career programs so working adults can complete credentials without leaving employment.
The most useful flexibility decisions come from role-level analysis rather than broad policy statements. Leaders need to know which jobs have strict coverage needs, which tasks can shift across hours, and which workers are most likely to leave when schedules are rigid. Chmura helps teams connect labor market data with the operational questions behind those choices, such as where talent is available, what wages are realistic, and how local commuting patterns affect the worker pool.
|
Workforce signal |
What it means for planning |
|
Total participation remains below February 2020 |
Broad recovery still leaves some workers outside paid work. |
|
Prime-age participation is above February 2020 |
Core working-age women remain strongly attached to employment. |
|
Unemployment is higher than before the shock |
Available workers still face job fit and access barriers. |
|
Caregiving costs affect work choices |
Labor supply depends on household logistics as well as wages. |
|
Regional patterns differ |
Local data will support better decisions than national averages. |
Workforce gaps look different across regions
Women’s labor force participation cannot be planned well from national averages alone. Regions differ in industry mix, commuting patterns, wage levels, school schedules, child care supply, and job access. A rate that looks stable nationally can hide tight labor conditions in one county and underused talent in another.
A site selection team comparing 2 metros should not only ask which market has more workers. It should ask how many women are active in the labor force, which occupations they hold, what wages are typical, and how far workers commute. An education leader reviewing program viability should compare local participation with job openings and wages before expanding a credential.
The risk of using broad averages is that they flatten the actual decision. A rural region with long drive times needs different workforce tactics than a dense metro with higher wages and higher care costs. A college near a major health system needs different program data than one serving a manufacturing-heavy area. Local labor market analysis makes those differences visible, which helps teams support grant applications, board presentations, hiring plans, and workforce strategies with clearer evidence.
Employers should focus first on preventable exits
Employers will get better results when they focus first on the conditions that push women out of jobs they would otherwise keep. Preventable exits often stem from scheduling conflicts, wage pressure, limited advancement opportunities, manager inconsistency, and roles that make caregiving responsibilities harder to manage.
The best starting point is a practical review of where exits cluster. A health care employer could compare turnover among evening-shift workers with that of daytime staff. A regional employer could review whether women leave most often after a schedule change, a missed promotion, or a return-to-office requirement. A workforce board could examine which occupations have openings but see weak participation by qualified women.
Strong retention work should answer 5 direct questions:
- Which roles have the highest exit rates among women workers?
- Which schedules create the most attendance strain?
- Which wages fall short of local living and care costs?
- Which locations create the longest commute burden?
- Which promotion points show the largest drop-off?
Those questions keep the work grounded. They also help leaders avoid generic fixes. A raise will not solve a schedule problem on its own. A flexible work policy will not fix a wage gap. A recruiting campaign will not repair a promotion bottleneck. The strongest plans match the problem to the worker experience.
Labor market data turns participation trends into workforce plans

Women’s labor force trends are most useful when they help leaders make better choices about jobs, programs, regions, and worker supports. The data shows resilience among prime-age women, continued weakness in total participation, and clear pressure from caregiving and job fit. That combination calls for disciplined planning rather than broad claims.
A strong workforce plan starts with the decision at hand. An economic developer needs to know whether a region can support a business expansion. An employer needs to know which schedules and wages will keep qualified workers. A college needs to know whether a program will lead to jobs that students can realistically take. Chmura fits this work when teams need to turn labor market data into defensible answers for reports, grants, board materials, and workforce plans.
“The clearest judgment is this: women’s participation is not simply rising or falling.”
Leaders who examine local data, job design, wages, care constraints, and worker movement will make stronger decisions than those who rely on headline rates alone.