People of color faced steeper job losses than White workers at the start of the pandemic.
Data
Forecasting
Economy
JobsEQ
Trends
Analysis
Consulting
Staffing
Plus
Pro
By Chmura Economics & Analytics
Published Apr 29, 2022
People of color[1] faced steeper job losses than White workers at the start of the pandemic. Moreover, as the economy began to expand, job growth for people of color increased at a slower pace when compared to their White counterparts, with Asian workers recovering those jobs the fastest and Black workers, the slowest.
Data from the Bureau of Labor Statistics (BLS) Quarterly Workforce Indicators (QWI) series and JobsEQ by Chmura indicate that between the fourth quarter of 2019 and the second quarter of 2020, the number of Black workers fell 13.3%--more than any other group (Figure 1). In contrast, the smallest decline (12.0%) was among White workers.
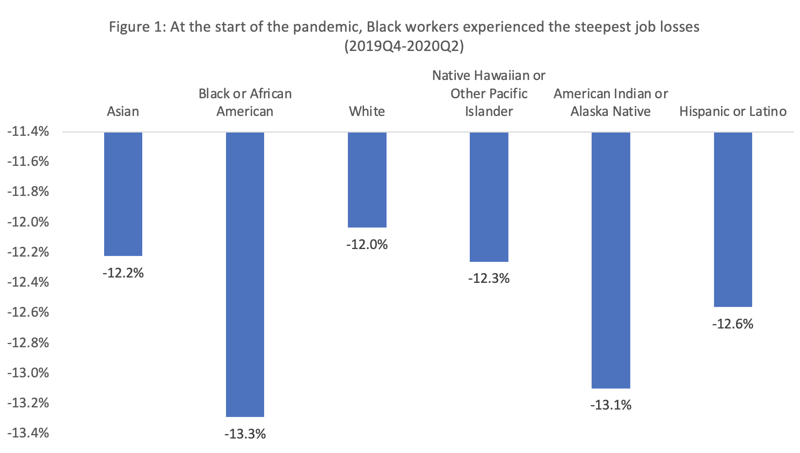
Source: QWI and JobsEQ by Chmura
Asian workers experienced the fastest job recovery. By the third quarter of 2021, Asian employment was at 83.9% of pre-pandemic levels (Figure 2). Black workers saw the slowest rebound at 53.5% over the same period.
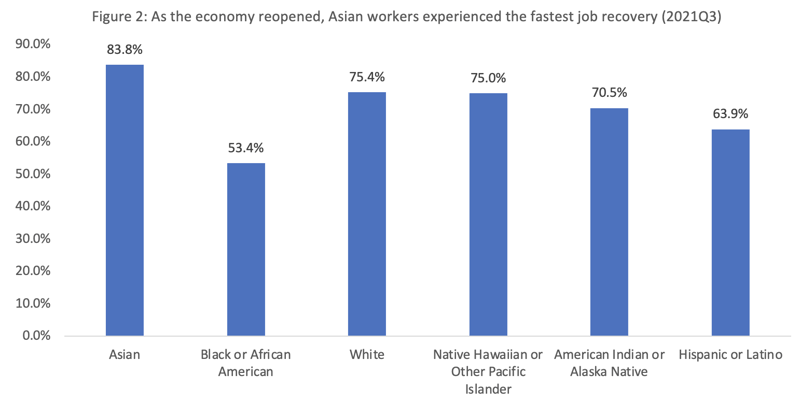
Source: QWI and JobsEQ by Chmura
People of color were disproportionately affected by the pandemic because they were employed in industries that suffered the largest job losses, as shown in the table below. According to the BLS, the industries showing the greatest job loss during the pandemic were accommodation and food services; arts, entertainment, and recreation; and retail trade.[2]
- In the accommodation and food services industry, Asian workers account for a greater share of employment compared to Black and White workers. During the pandemic, Asian and Black workers in the industry experienced the largest decline in employment, at 39.4% and 37.0% respectively, compared to the 36.3% decline among White workers.
- In the retail trade industry, Black workers account for a greater share of employment compared to Asian and White workers. During the pandemic, Asian and Black workers in the industry experienced larger declines in employment, at 16.0% and 15.9% respectively, compared to the 14.8% decline among White workers.
- In the arts, entertainment, and recreation industry, Black and Asian workers account for a greater share of employment compared to White workers. During the pandemic, Black workers in the industry experienced the largest decline in employment at 37.9%, followed by White workers (37.2%), and Asian workers (35.3%).
People of color and White workers experienced job losses and recovered at similar rates in industries such as professional, scientific, and technical services; manufacturing; and wholesale trade.
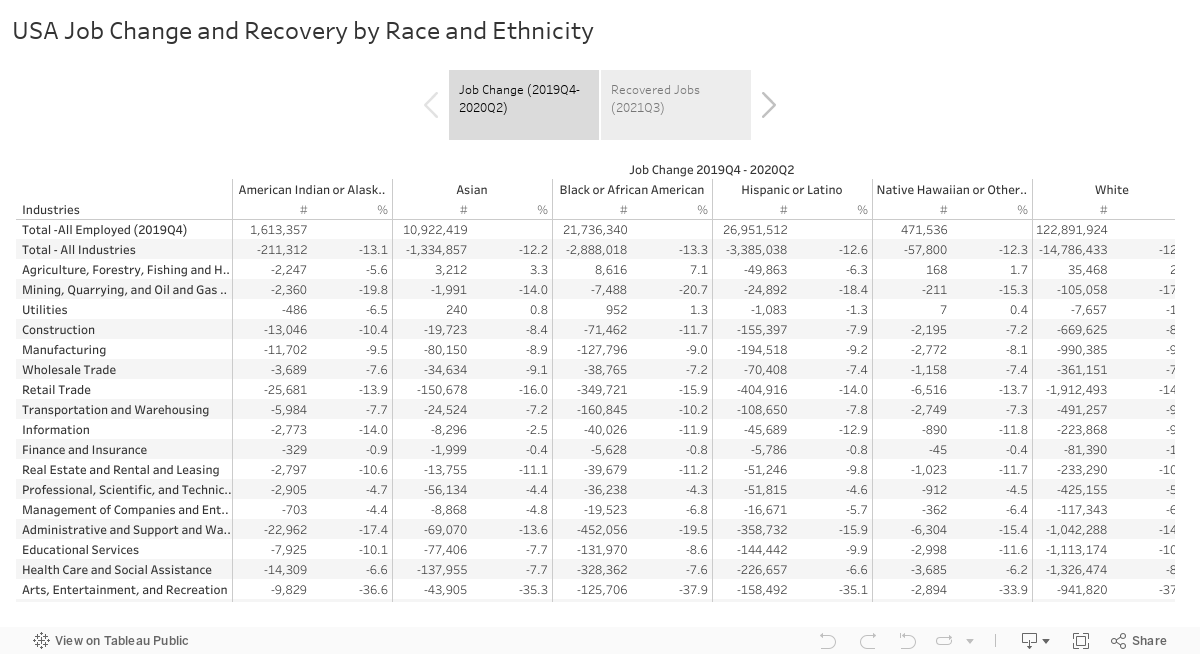
Source: QWI and JobsEQ by Chmura
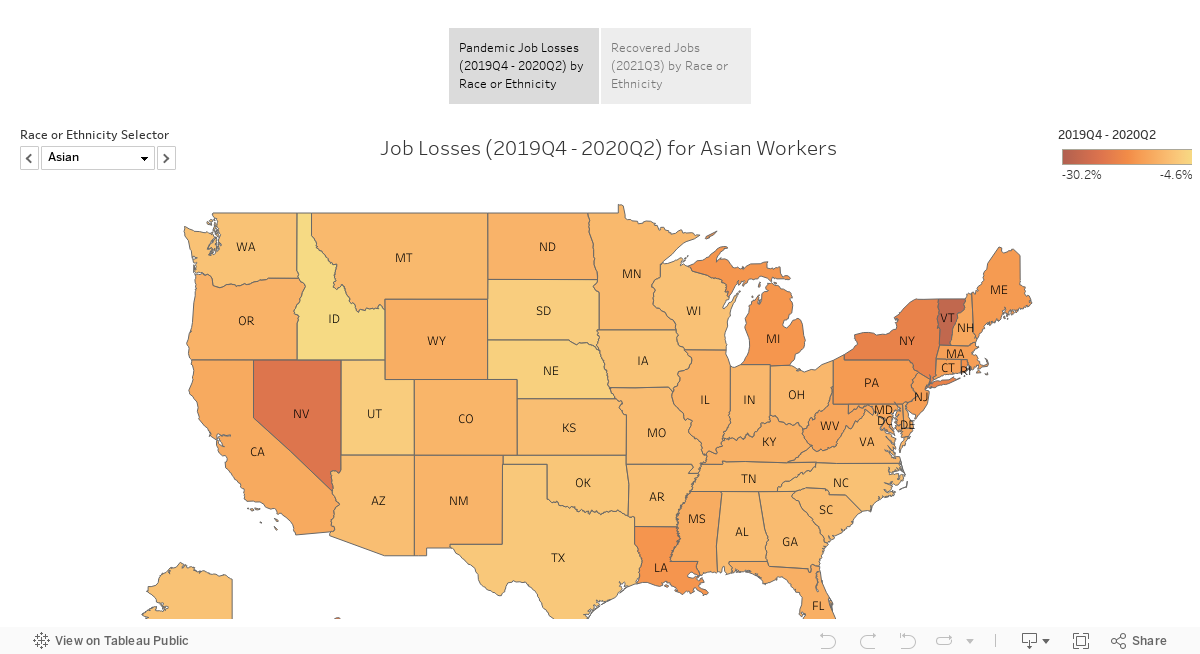
Significant regional variation exists in the recovery of employment among people of color and White workers.[3] The maps below summarize statewide impacts and recovery by race and ethnicity. The largest differences in job losses between people of color and White workers were in the Midwest, specifically North Dakota, Wisconsin, and Ohio. In contrast, recovery has been faster for people of color in the West, specifically California, Oregon, and Washington.
With some variation between states, the pandemic has disproportionately impacted people of color in the workforce. Employers, local governments, and workforce development boards should consider this disparity while developing strategies to assist Blacks who want to return to work and encourage those not in the labor force to rejoin.
Source: QWI and JobsEQ by Chmura
[1] People of color are defined as Asian, Black, Hispanic or Latino, Native Hawaiian or Other Pacific Islander, and American Indian or Alaska Native.
[2] Source: https://www.bls.gov/spotlight/2021/impact-of-the-coronavirus-pandemic-on-businesses-and-employees-by-industry/home.htm
[3] Participation in QWI data collection is up to individual states, and the latest data available varies. Alaska data are through 2016Q2, while Arkansas and Mississippi are through 2018Q2. Chmura used national trends to bring these state estimates forward. All others are updated through 2020Q4, with preliminary estimates through 2021Q3 by Chmura. As in the national data analysis, unclassified sector data are excluded.


