Signs of labor market tightness persist through the beginning of 2022 according to the latest job ads data.
Data
Forecasting
Economy
JobsEQ
Trends
Analysis
Consulting
Staffing
Plus
Pro

By Chmura Economics & Analytics
Published May 20, 2022
Signs of labor market tightness persist through the beginning of 2022 according to the latest job ads data. These indicators include substantial wage increases among some occupations as well as the continued popularity of sign-on bonuses.
The Overall Market
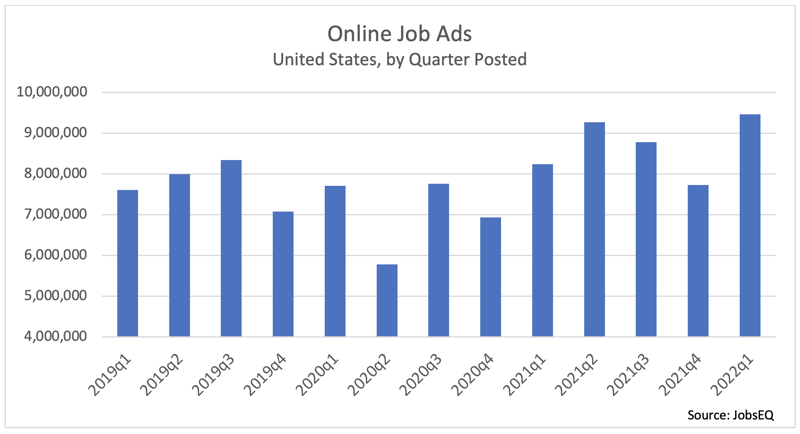
New online job ad volume reached a high in the first quarter of 2022 at 9.46 million ads. This exceeded the previous post-COVID peak which occurred in the second quarter of 2021 at 9.28 million. New job ads reached a trough of 5.78 million in the second quarter of 2020 as lockdowns due to the pandemic were first put in place.
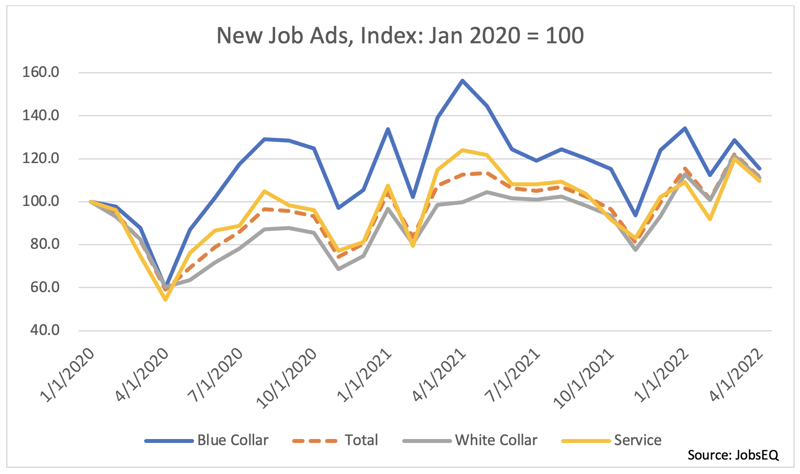
The recent surge in job ads has been especially strong among white-collar jobs.[1] Following the decrease in job ads coinciding with the initial COVID lockdowns, blue-collar jobs recovered the quickest, partially due to increased demand for transportation and material moving jobs. White-collar and services jobs appear to be finally catching up in terms of relative growth in new job ads since the beginning of 2020. Some white-collar jobs with especially higher job ad volume in early 2022 include registered nurses, software developers, and secretaries.
Wage Pressures
|
Wages in Job Ads, Jan-Apr 2022 vs. Jan-Apr 2021 |
||||
|
Occupation |
New Job Ads, 2022 |
2022 Median Hourly Wage |
2021 Median Hourly Wage |
Wage % Increase |
|
Retail Salespersons |
395,877 |
$15.00 |
$13.40 |
12% |
|
First-Line Supervisors of Retail Sales Workers |
375,354 |
$17.43 |
$15.19 |
15% |
|
Fast Food and Counter Workers |
195,018 |
$13.10 |
$11.23 |
17% |
|
First-Line Supervisors of Food Preparation and Serving Workers |
163,089 |
$16.75 |
$14.60 |
15% |
|
Janitors and Cleaners, Except Maids and Housekeeping Cleaners |
128,682 |
$15.00 |
$13.00 |
15% |
|
Personal Care Aides |
81,882 |
$14.33 |
$12.40 |
16% |
|
Cashiers |
74,675 |
$13.69 |
$11.00 |
24% |
|
Cooks, Restaurant |
73,168 |
$15.40 |
$13.00 |
18% |
|
Food Preparation Workers |
67,495 |
$14.53 |
$12.50 |
16% |
|
Waiters and Waitresses |
64,380 |
$13.00 |
$10.37 |
25% |
|
Source: JobsEQ |
||||
As we’ve noted previously, wages in 2021 made a substantial jump, particularly among lower-paying jobs. This trend has continued into the beginning of 2022. Prominent occupations with lower-than-average wages have been hard to fill and have seen a corresponding increase in compensation as employers attempt to fill these positions. Wages disclosed in job ads indicate double-digit percentage increases in pay for these openings which include many food-service jobs (food prep workers, waiters and waitresses, and cooks) as well as retail positions.
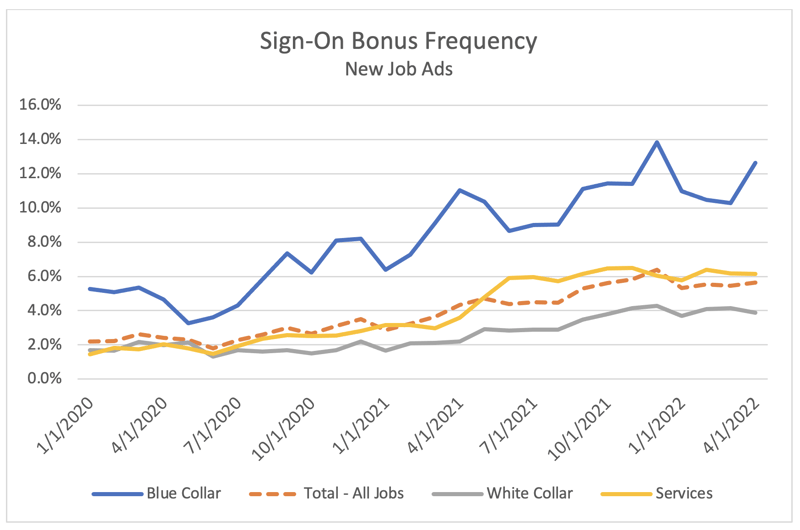
The practice of offering sign-on bonuses has remained at elevated levels, a sign of a continuing tight labor market. About 2.3% of all new jobs ads in the first quarter of 2020 explicitly mentioned a sign-on bonus. This practice began increasing in popularity in the second half of 2020. By the first quarter of 2021, 3.2% of all job ads included sign-on bonuses, increasing to 5.4% in the first quarter of 2022. Sign-on bonuses have been and continue to be more popular among blue-collar occupations such as truck drivers. This benefit, however, has also seen growth among some service and white-collar jobs.
About the Data
All job postings data above are derived from, the Real-Time Intelligence online job ad data set, pulled from over 40,000 websites and updated daily. Historical volume is revised as additional data are made available and processed. Each month of ads is defined as new online ads that first appeared in that month. All ad counts represent deduplicated figures. The relationship between ad counts and actual hires is described here.
Sign-on bonus offers in the ads data cited above were identified via the presence of one of several keyword phrases: “sign-on bonus,” “hiring bonus,” “starting bonus,” or “signing bonus.” If sign-on bonuses were indicated in the job ads with some other verbiage, or were not indicated at all, any presence of these bonuses for those jobs are not captured in the data above.
[1] White-collar jobs are defined as those in SOC codes beginning 11-29 and 41-43, blue-collar jobs are those beginning with 45-53, and service jobs are the remaining occupations beginning with 31-39.


