Many U.S. employers have had a hard time filling jobs in 2021 and wages have consequently made a substantial jump. According to the evidence from job ads, the above-average wage increases are largely focused on lower-paying jobs.
Workforce
Data
Forecasting
JobsEQ
Trends
Analysis
Staffing

By Chmura Economics & Analytics
Published Aug 31, 2021
Many U.S. employers have had a hard time filling jobs in 2021 and wages have consequently made a substantial jump.[1] According to the evidence from job ads, the above-average wage increases are largely focused on lower-paying jobs.
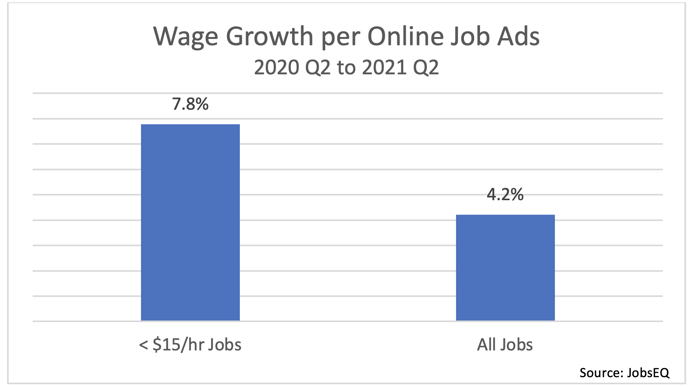
Within online job ads,[2] wages in the second quarter of 2021 grew 4.2% compared to a year earlier, though wages for jobs making less than $15 per hour jumped 7.8%.[3] Much of the growth in lower wage jobs occurred in the second quarter of 2021, though, initial data from July indicate the pace of increases are slowing.
| Median Wages, per Online Job Ads [4] | |||
| 2020 Q2 | 2021 Q2 | % Change | |
| Bartenders | $9.04 | $10.40 | 15% |
| Waiters and Waitresses | $9.50 | $11.00 | 16% |
| Amusement and Recreation Attendants | $10.40 | $12.50 | 20% |
| Baristas | $10.40 | $12.34 | 19% |
| Hotel, Motel, and Resort Desk Clerks | $10.52 | $12.40 | 18% |
| Dishwashers | $10.58 | $12.30 | 16% |
| Nannies | $12.50 | $15.00 | 20% |
| Source: JobsEQ | |||
According to the Bureau of Labor Statistics Employment Cost Index, [5] the leisure and hospitality sector has seen larger than average wage increases in 2021. This is supported in the job ads where we see many of the detailed occupations that recorded especially large wage increases are largely employed in this sector. Amusement and recreation attendants, for example, saw a 20% increase in wages over the past year.
Signs of labor market tightness can also be seen in the number of ads that have been closing. If you compare the number of ads that closed within a quarter to the total number of ads that were active at some point in the same quarter, you arrive at a ratio that gives an indicator of the job ad churn. A higher ratio indicates job ads are churning at a high rate, implying hiring is occurring at a quicker pace compared to a lower ratio which would indicate the jobs are not getting filled as quickly.
| Ratio of Closed Ads to Active Ads | |||
| 2019 Q2 | 2020 Q2 | 2021 Q2, | |
| < $15/hour jobs | 83% | 87% | 78% |
| $15 - $20/hour jobs | 87% | 91% | 81% |
| > $20/hour jobs | 89% | 93% | 81% |
| Source: JobsEQ | |||
The ratio of closed-to-active jobs over the last three second quarters illustrates the struggles within the labor market. In the second quarter of 2020, the economy slowed dramatically and with that the number of new job ads plummeted. As a result, the number of closed ads increased across the board relative to all active jobs. In 2021 quarter two, in contrast, many jobs have become harder to fill and the number of closed ads dropped relative to all ads, and this decline has occurred across all wage levels.
About the Data
All job postings data above are derived from JobsEQ, the Real-Time Intelligence online job ad data set, pulled from over 40,000 websites and updated daily. Historical volume is revised as additional data are made available and processed. Each month of ads is defined as new online ads that first appeared in that month. All ad counts represent deduplicated figures. The relationship between ad counts and actual hires is described here.
All wages cited above are obtained from wage levels explicitly disclosed in the job ads. Wages are disclosed in roughly one-eighth of all ads. Note that wage changes in job ads can be relatively volatile and changes may occur for reasons unrelated to actual wages changes in the overall economy; for example, if a large volume of ads shifts from regions with a lower cost of living to those with a higher cost of living; in another example, if within an occupation ads shift from positions requiring less education and experience to those requiring more.
[1] https://www.bloomberg.com/news/articles/2021-06-09/surprise-jump-in-u-s-wages-gives-inflation-debate-a-new-twist
[2] Online job ads data are per the JobsEQ RTI (Real-Time Intelligence) data set; see methodology notes at the end of the article.
[3] These growth rates represent the change in median wages, evaluated by examining the median wage for each 8-digit SOC occupation at the national level, holding the relative mix of those jobs constant over time (according to the average mix over that same time), and computing the change in wages for the aggregate group. The “less than $15 per hour” occupation group was defined according to 8-digit occupations and their average wage values as found in online job ads from 2019Q4 through 2021Q2; this same time frame was used to define the “$15 to $20/hr” group and “over $20/hr” group used later in the blog.
[4]Note that these figures indicate wages disclosed in job ads which would not necessarily incorporate possible tips for those jobs where tips constitute an important component of total compensation.


