Women in the workforce faced steeper job losses than men and those jobs are recovering more slowly than for men across the nation.
Workforce
Covid-19
Data
Forecasting
Economy
Analysis
Consulting
Staffing
Pro
Economic Trends
By Patrick Clapp
Published Nov 22, 2021
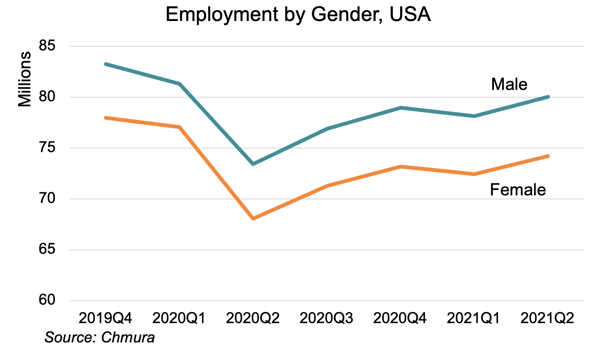
Women in the workforce faced steeper job losses than men at the start of the pandemic, and those jobs are recovering more slowly than for men across the nation.
Data from the Quarterly Workforce Indicators series from the Bureau of Labor Statistics and Chmura’s JobsEQ indicate that between the fourth quarter of 2019 and the second quarter of 2020, the number of women employed fell 12.7%, compared with a decline of 11.8% for men. As of the second quarter of 2021, female employment has recovered an estimated 62% of jobs lost, five percentage points below the 67% recovered by men.
The greater impact for women stems largely from the industries most impacted by the pandemic. Consistent with previous research, and as shown in the table below, the greatest job losses for women were in accommodations and food services, health care and social assistance, and retail trade—all industries in which women account for a greater share of employment. However, within these industries women bore a greater share of job losses. For example, 16.4% of women in retail trade lost their jobs, compared with 13.6% of men. This disparity has continued during the recovery, as women have recovered 59% of jobs lost in retail trade, compared with 73% for men. These differences do not hold across all industries. Women and men experienced job losses and have recovered at similar rates in industries such as professional, scientific, and technical services; information; real estate and rental and leasing; and finance and insurance.
|
USA Job Change and Recovery by Gender |
||||||||
|
|
Job Change 2019Q4 - 2020Q2 |
Recovered Jobs (2021Q2) |
||||||
|
Female |
Male |
Female |
Male |
|||||
|
Total - All Industries |
-12.7% |
-9,900,079 |
-11.8% |
-9,844,718 |
62% |
6,135,408 |
67% |
6,618,883 |
|
Agriculture, Forestry, Fishing and Hunting |
0.8% |
5,757 |
3.0% |
41,166 |
n/a |
n/a |
n/a |
n/a |
|
Mining, Quarrying, and Oil and Gas Extraction |
-15.9% |
-16,768 |
-18.2% |
-102,152 |
0% |
50 |
0% |
261 |
|
Utilities |
-0.5% |
-927 |
-1.0% |
-6,032 |
-68% |
-632 |
-33% |
-1,977 |
|
Construction |
-6.4% |
-104,023 |
-9.0% |
-686,702 |
120% |
125,025 |
84% |
575,166 |
|
Manufacturing |
-10.3% |
-397,282 |
-9.1% |
-834,569 |
50% |
199,850 |
58% |
482,371 |
|
Wholesale Trade |
-8.1% |
-151,187 |
-7.1% |
-295,317 |
39% |
59,616 |
45% |
133,884 |
|
Retail Trade |
-16.4% |
-1,378,334 |
-13.6% |
-1,128,945 |
59% |
806,499 |
73% |
821,308 |
|
Transportation and Warehousing |
-10.1% |
-233,160 |
-8.8% |
-465,528 |
74% |
172,071 |
86% |
399,909 |
|
Information |
-8.6% |
-104,850 |
-9.3% |
-180,049 |
61% |
64,182 |
57% |
101,935 |
|
Finance and Insurance |
-1.4% |
-52,519 |
-1.4% |
-36,856 |
117% |
61,488 |
117% |
43,303 |
|
Real Estate and Rental and Leasing |
-10.5% |
-127,269 |
-10.7% |
-169,988 |
63% |
80,555 |
62% |
106,054 |
|
Professional, Scientific, and Technical Services |
-4.4% |
-221,563 |
-5.3% |
-309,396 |
143% |
316,540 |
119% |
366,766 |
|
Management of Companies and Enterprises |
-6.4% |
-79,428 |
-5.9% |
-69,977 |
18% |
14,673 |
20% |
14,041 |
|
Administrative and Support and Waste Management and Remediation Services |
-16.2% |
-727,063 |
-15.4% |
-905,428 |
63% |
460,489 |
67% |
606,662 |
|
Educational Services |
-10.2% |
-867,083 |
-9.8% |
-499,149 |
25% |
214,834 |
26% |
128,334 |
|
Health Care and Social Assistance |
-8.2% |
-1,493,025 |
-6.9% |
-349,929 |
68% |
1,016,417 |
83% |
290,054 |
|
Arts, Entertainment, and Recreation |
-37.5% |
-566,103 |
-37.0% |
-590,603 |
62% |
349,153 |
63% |
373,174 |
|
Accommodation and Food Services |
-37.2% |
-2,881,722 |
-35.9% |
-2,375,097 |
61% |
1,746,979 |
64% |
1,524,296 |
|
Other Services (except Public Administration) |
-20.8% |
-780,026 |
-13.9% |
-470,577 |
58% |
456,140 |
96% |
449,737 |
|
Note: the public administration and unclassified sectors are excluded from this analysis due to data availability. Recovery data are not shown for the agricultural sector as its employment expanded over this period. Source: Chmura, JobsEQ®, QWI |
||||||||
In an April 2021 blog we covered some possible reasons for the disparity, including women taking on a greater share of childcare, as well as fear of returning to work in high-contact sectors and risking contracting the virus. Recent evidence suggests the impact of remote learning on labor force participation for women is small, and a return to in-person schooling may not significantly shift the recent trend in women’s labor force participation.
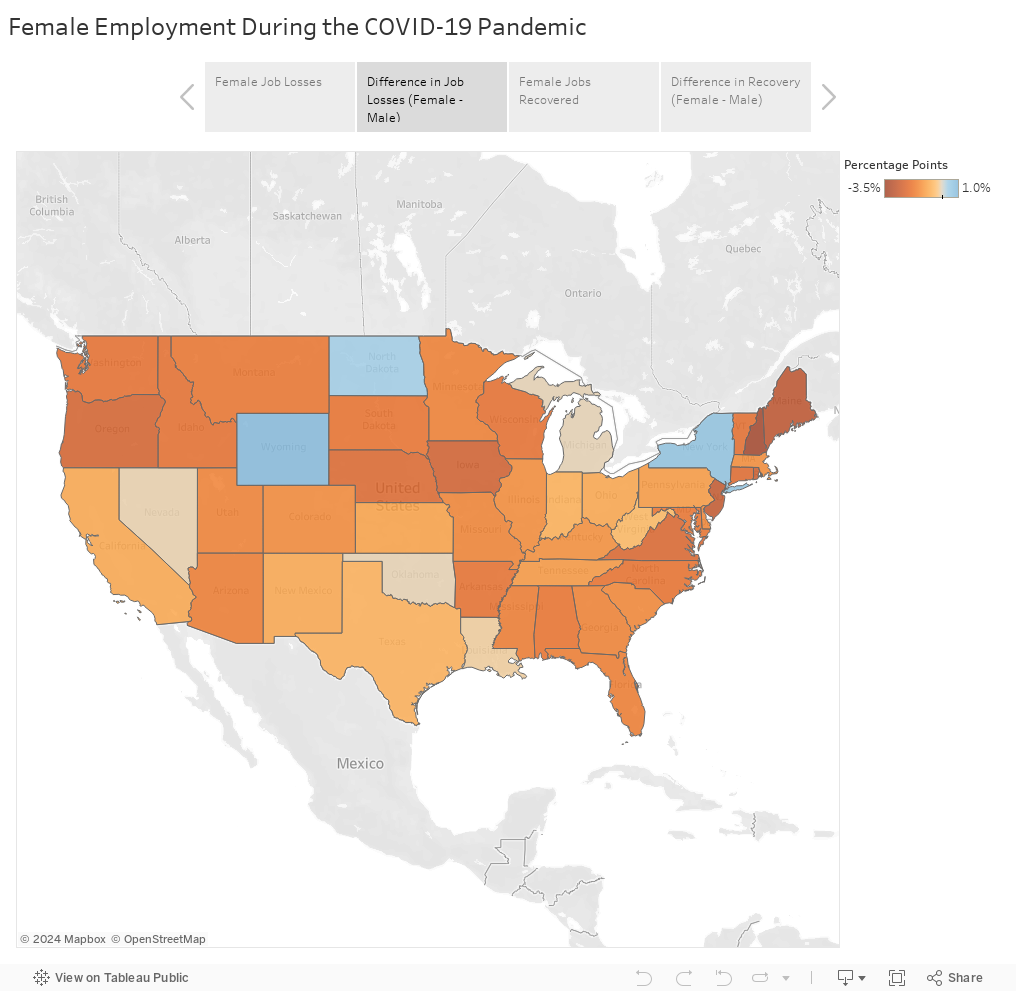
There is also significant regional variation in female employment during the recovery. The maps below summarize statewide impacts and recovery by gender. [1] The largest differences in job losses by gender were in the Northeast, specifically New Hampshire, Maine, and New Jersey, as strict and rapid shutdowns limited in-person jobs and women also lost a greater share of jobs in industries like manufacturing and transportation and warehousing that were more resilient in other states. In contrast, the recovery has been faster for women in Wyoming, North Dakota, and Louisianna, which experienced fewer impacts due to pandemic shutdowns. In addition, growth in jobs held by women in professional, scientific and technical services and real estate and rental and leasing have boosted overall female employment job recovery relative to men.
With some variation between states, women in the workforce have been disproportionately impacted by the pandemic and have recovered more slowly. Localities and employers should consider this disparity while developing strategies to assist women who want to return to work and encourage those not in the labor force to rejoin.
Research support provided by Jonathan Campbell
[1] Participation in QWI data collection is up to individual states, and the latest data available varies. Alaska data are through 2016Q2, while Arkansas and Mississippi are through 2018Q2. Chmura used national trends to bring these state estimates forward. All others are updated through 2020Q3, with preliminary estimates through 2021Q2 by Chmura. As in the national data analysis, unclassified sector data are excluded.


