Households with student loan debt will be rethinking spending and saving priorities, and those changes will ripple throughout the economy during this important holiday season. In early 2020, the Office of Federal Student Aid suspended loan payments in response to the economic hardships brought about by the COVID-19 pandemic.
Data
Economy
JobsEQ
Analysis
Consulting
Plus
Pro
Economic Trends

By Chmura Economics & Analytics
Published Dec 18, 2023
The National Center for Education Statistics recently released awards data for the 2021-2022 academic year. Some of the more notable trends are highlighted below and placed in context of the current and projected demand within the US labor market.
Overall Volume Trends
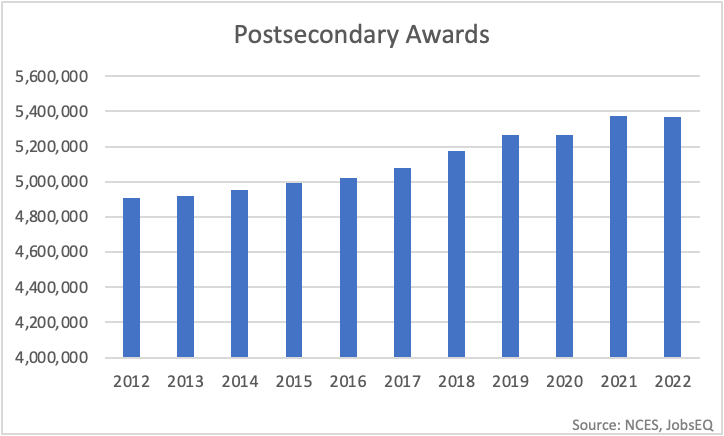
In the 2022 academic year,[1] close to 5.4 million awards were granted by U.S. postsecondary institutions, down a slight 0.06% from the previous year. Nevertheless, awards in 2022 were more than nine percent higher than they were ten years earlier (4.9 million in 2012).
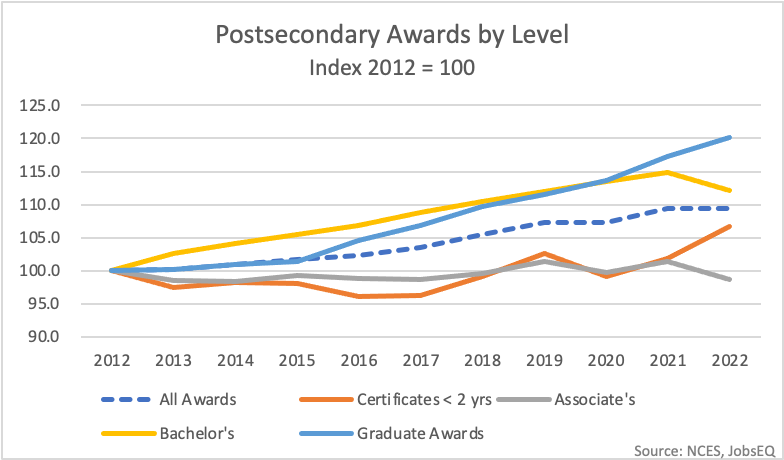
Over the past ten years, graduate awards have grown the fastest among the different award levels followed by bachelor's degrees. This fast growth of graduate awards is well-aligned with demand data. The hiring demand for master’s degrees and doctoral or professional degrees has expanded fastest relative to other education levels in recent years. Based on RTI demand data,[2] job ads for master’s degrees and doctoral or professional degrees increased 42% and 55%, respectively, from 2018 through 2022.
Associate’s degree awards were roughly flat over the last ten years and were down slightly (-1.3%) in 2022 compared to 2012. Certificates less than two years in length were also about flat from 2012 through 2020, but have grown significantly (+7.7%) the last two academic years.
The growth in certificates the last two years was spread out across many programs.[3] There were 133 different programs that granted at least 1,000 awards in the 2020 academic year; by 2022, 74 of those had expanded. Some of the largest volume increases were in personal care programs such as skin care, nail technicians, and cosmetology. There was also significant growth in production and repair fields such as welding, electrician, and HVAC programs. Medical programs also grew in this period, including medical/clinical assistant, dental assistant, EMT, and phlebotomy programs.
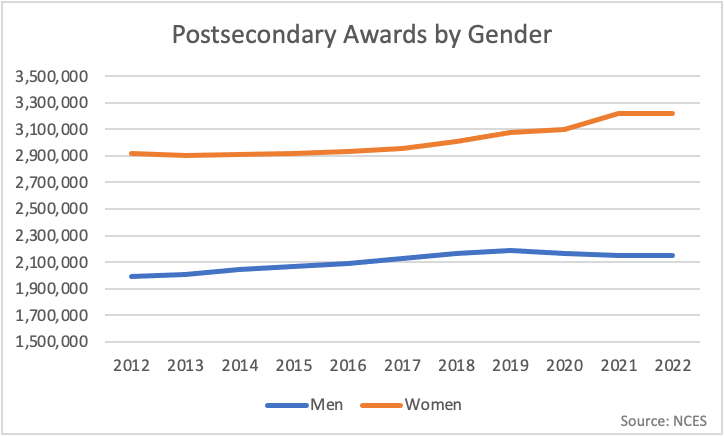
The gap between women and men award earners has widened, especially over the last several years. In 2012, 59.4% of awards were granted to women and that grew to 60.0% in 2022. This mix isn’t all that much different when it comes to four-year or higher degrees. In 2022, 59.8% of bachelor’s degrees were earned by women and 60.4% of graduate degrees.
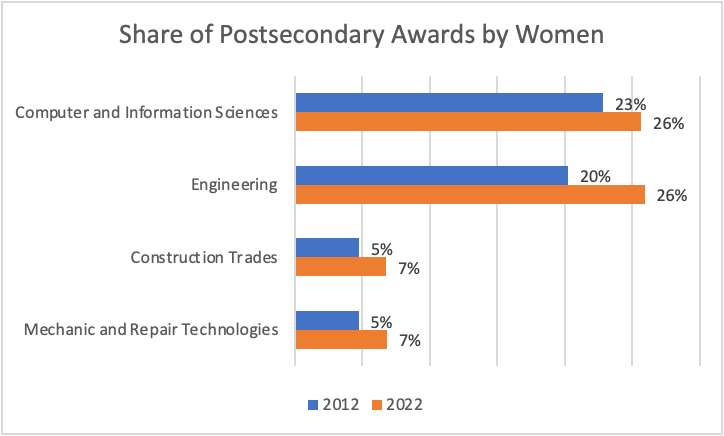
Over the past ten years, women have also become slightly more present in fields of study still largely populated by men. For example, 26% of awards in computer and information sciences (CIP 11) were granted to women in 2022 compared to 23% in 2012. Awards in engineering (CIP 14) were also at 26% women in 2022 and this compares to 20% in 2012. Even construction trades (CIP 46) and mechanic and repair technologies (CIP 47) shifted a bit, with 7% of awards granted to women in 2022, up two percentage points from ten years earlier.
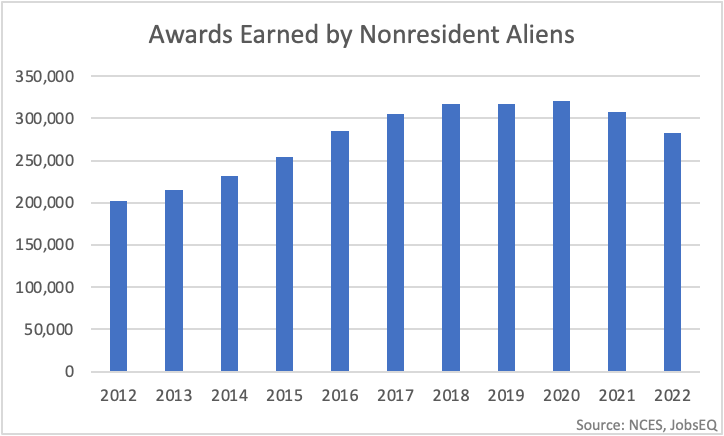
The number of awards earned by nonresident aliens peaked in the 2020 academic year at 320,837 but has fallen off in the subsequent two years. This trend was mirrored in bachelor’s degrees which peaked at 114,909 for nonresident aliens in 2020 before falling to 103,201 in 2022. Master’s degrees for this group peaked in 2017 at 146,720 but has trailed off since, hitting 117,496 in 2022. Doctorate degrees, however, have continued to rise for nonresident aliens, reaching a new peak of 25,489 in 2022.
|
Race/Ethnicity |
2012 |
2022 |
% Change |
|
Total |
4,909,233 |
5,367,310 |
9.3% |
|
American Indian or Alaska Native |
35,757 |
31,403 |
-12.2% |
|
Asian |
258,482 |
370,069 |
43.2% |
|
Black or African American |
588,429 |
596,232 |
1.3% |
|
Hispanic or Latino |
545,232 |
953,062 |
74.8% |
|
Native Hawaiian or Other Pacific Islander |
13,912 |
12,228 |
-12.1% |
|
White |
2,862,073 |
2,710,536 |
-5.3% |
|
Two or More Races |
65,111 |
189,157 |
190.5% |
|
Race/Ethnicity Unknown |
337,694 |
221,810 |
-34.3% |
|
Source: NCES, JobsEQ |
|||
Among the race and ethnicity groups, Hispanic or Latinos recorded the biggest increase in postsecondary awards over the last ten years, expanding awards earned by nearly 75%. This rate of increase was even larger among the higher degrees. From 2012 to 2022, bachelor’s degrees earned by Hispanic or Latinos grew 97% and master’s degrees expanded 109%.
Supply versus Demand
Measuring demand for postsecondary education, whether at the national or local level, is an involved process that needs to incorporate multiple metrics to obtain a balanced view. It is beyond the scope of this blog for a thorough analysis of supply versus demand at the national level, but we present below a few items to note among the occupation groups that predominantly require college education. (All awards by occupation are based on a program-to-occupation crosswalk.)[4]
|
Occupation Group |
Awards 2012 |
Awards 2022 |
Awards Change 2012 - 2022 |
Empl 2022 |
Forecast Empl Change 2022 - 2032 |
Active Job Ads Change 2018 - 2022 |
|
Computer and Mathematical |
229,594 |
435,857 |
90% |
5,195,967 |
18% |
25% |
|
Management |
1,884,561 |
2,334,166 |
24% |
12,072,160 |
7% |
35% |
|
Life, Physical, and Social Science |
718,618 |
849,810 |
18% |
1,407,336 |
7% |
18% |
|
Community and Social Service |
333,301 |
388,623 |
17% |
2,874,024 |
11% |
18% |
|
Healthcare Practitioners and Technical |
608,497 |
703,471 |
16% |
9,351,627 |
9% |
29% |
|
Architecture and Engineering |
250,793 |
289,170 |
15% |
2,600,961 |
6% |
35% |
|
Business and Financial Operations |
783,395 |
880,223 |
12% |
10,224,986 |
8% |
17% |
|
Educational Instruction and Library |
3,684,863 |
4,112,325 |
12% |
8,545,335 |
3% |
-14% |
|
Arts, Design, Entertainment, Sports, and Media |
414,669 |
390,313 |
-6% |
3,009,574 |
4% |
6% |
|
Legal |
74,969 |
64,336 |
-14% |
1,334,125 |
5% |
13% |
|
Source: JobsEQ, NCES, BLS |
||||||
Over the last ten years, awards have increased most quickly in the computer and mathematical group. This aligns well with demand: for this occupation group job ads have grown quickly and employment is forecast to grow the fastest[5] (18%) through 2032.
Demand in the education group is projected to be slowest, expanding 3% from 2022 to 2032. This slower growth is partially due to an expected drop in population of younger age groups in the coming years. The number of individuals in the United States under age 18 is expected to drop from 72.5 million in 2022 to 67.9 million in 2035, and the population of those aged 18 to 24 is forecast to decline from 31.3 million in 2022 to 29.7 million in 2035.[6]
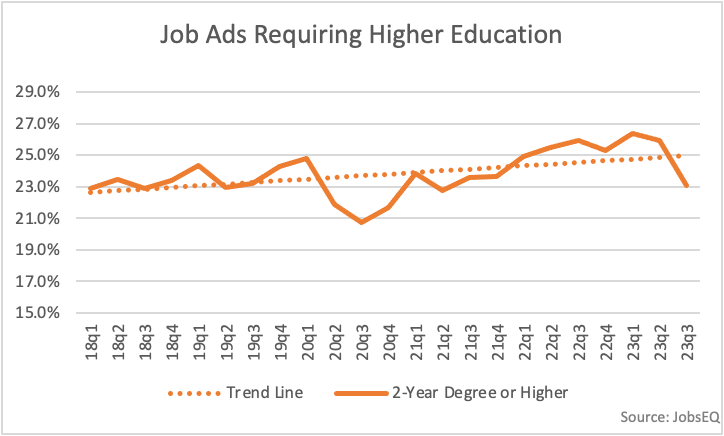
Overall, demand for higher education remains strong. In the third quarter of 2023, about 23% of job ads explicitly listed a requirement for a two-year college degree or higher.[7] This percentage is about the same as it was in the first quarter of 2018, so you can say demand has held approximately steady. Nevertheless, the trend line for this requirement over the past five years is sloping upwards, consistent with an overall increasing demand for higher education.
--------------------------------------------
[1] All academic year references in this blog are labeled according to the year of the spring semester in which that academic year ends. For example, the 2022 academic year refers to the year ending in spring 2022.
[2] JobsEQ is Chmura’s labor market data platform which contains the RTI (real-time intelligence) data set, composed of online job ads data gleaned from over 45,000 websites, updated daily.
[3] “Program” here is defined as a field of study defined by a six-digit CIP (Classification of Instructional Programs) code
[4] The “CIP-to-SOC” crosswalk used for this procedure is one that is largely based on the NCES crosswalk but also expanded by Chmura (the additions account for less than 10% of the total crosswalk).
[5] The employment forecast is from JobsEQ and includes estimates of employment growth that has occurred from 2022 through 2023Q2 (as measured by JobsEQ, which leverages various employment data sets such as QCEW and OEWS) as well as projected growth through 2032 that leverages the BLS long-term ten-year forecast.
[6] Per US Census Bureau projections found here: https://www.census.gov/programs-surveys/popproj.html.
[7] Note that up to about half of job ads do not specify any educational requirement—which can mean that there is no requirement for those, but it can also mean that the requirement is simply unstated or implied. Also note the percentage of job ads requiring higher education shifts quarter-to-quarter partially due to the changing mix of open jobs at any given time.


