The spike in COVID-19 cases is expected to lead to slower employment growth in the nation based on the drop in job postings recorded in Chmura’s Real...
Covid-19
Forecasting
By James Stinchcomb
Published Nov 24, 2020
The spike in COVID-19 cases is expected to lead to slower employment growth in the nation based on the drop in job postings recorded in Chmura’s Real Time Intelligence (RTI).
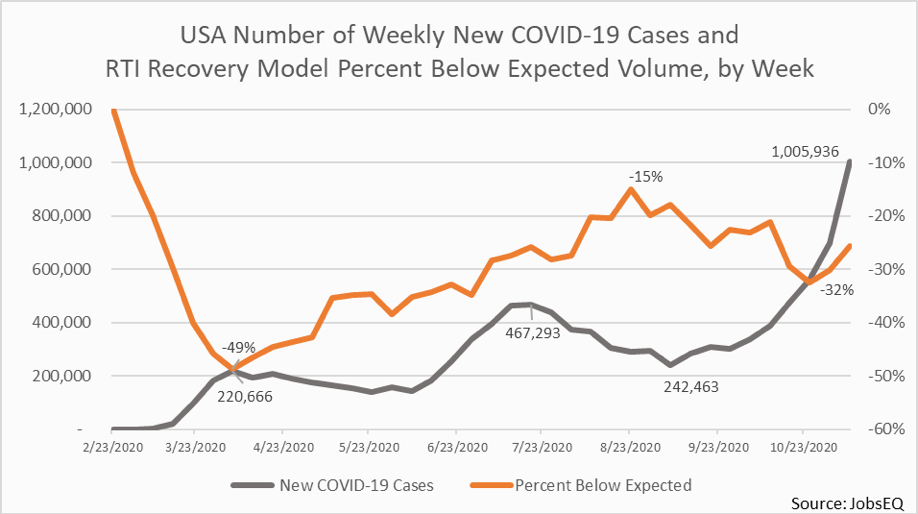
Since the end of the summer, cases of COVID-19 have risen dramatically across the United States, with a particularly large spike at the end of October that has continued through November. According to the CDC,[1] the number of new weekly cases increased by 55% between the week of August 16, 2020 through the week of October 18, 2020 but have increased by 149% in the four weeks since, through November 15, 2020. At the same, job posting volume has decreased from a post-pandemic high of 15% below expected volume during the week of August 23, 2020 to 26% below expected volume during the week of November 8, 2020, far outpacing the seasonal drop in volume during in the fall that we typically expect.
Above is a chart[2] showing the number of new COVID-19 cases per week in the United States along with the RTI Recovery Model’s percentage difference between expected and observed job posting volume. As many of the business shutdown orders came to an end in late spring, job posting volume began recovering, accelerating even more rapidly at the end of the summer as new daily cases began falling. Coinciding with new cases beginning to rise again at the beginning of September, job posting volume began declining. During the week of October 25, 2020, job postings fell below 30% less than expected volume for the first time since June.
While every state except Hawaii has seen the average weekly number of new cases per week increase since the end of the summer, some of the hardest hit states during the recent surge have been those in the west and states with smaller populations that didn’t see as many cases during the spring. Five states have seen the average weekly number of new cases increase by over 800% from the three-week period of September 6 – 26, 2020 through the three-week period of November 1 – 21, 2020: Vermont, New Mexico, Wyoming, Connecticut, and Colorado.
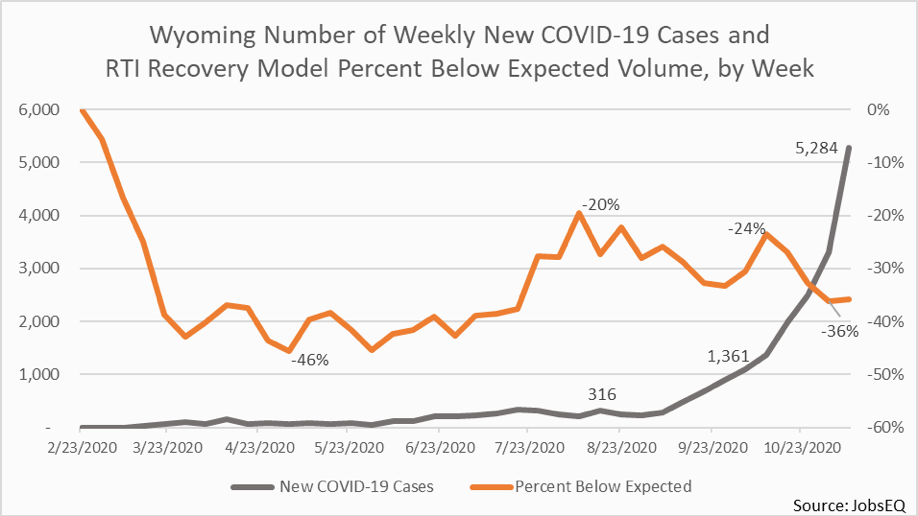
Wyoming, one of the smaller states in the nation, was not as heavily affected by COVID-19 early on in the pandemic, not consistently seeing over 100 new cases per week until June and seeing over 1,000 new weekly cases for the first time during the week of October 4, 2020. Since September, cases have been increasing dramatically, with the average weekly number of cases increasing from 486 during the three-week period of September 6 – 26, 2020 to 4,704 during the three-week period of November 1 – 21, 2020, an increase of 867%. Compared to the recovery model, volume has remained under 30% below expected for the past four weeks, after reaching a peak of 20% below expected volume in August and being as high as 24% below expected during the week of October 11, 2020.
Throughout the autumn and through the end of the year, RTI job posting volume normally falls, with an expected decline of around 35% from the beginning of August through the end of the year, before increasing again following the New Year’s holiday. As shown in the chart, job posting volume has declined faster than expectations during this period, corresponding with the rapid increase in COVID-19 cases. The implication is that employment growth in the nation is likely to slow as well. Chmura will continue to monitor RTI volume throughout the winter to track the impact of the COVID-19 pandemic on the U.S. economy
[1] https://covid.cdc.gov/covid-data-tracker/
[2] The increase in RTI job postings volume compared to the expected volume seen in the most recent week is due to a quirk in the model and the Thanksgiving holiday. In the previous two years Thanksgiving has fallen in two different weeks of the year, and since the model incorporates not only the holiday itself but also the specific week of the year, the model’s expected volume is significantly lower in both the week of Thanksgiving and the week prior (the week of Thanksgiving in 2018).