Hiring patterns for tech workers in some of the largest metro areas have followed consistent trajectories from the start of the COVID-19 pandemic through 2022, but the current slowdown in the tech sector is hitting top metros differently.
Data
Forecasting
Economy
JobsEQ
Analysis
Consulting
Plus
Pro
Economic Trends

By Patrick Clapp
Published Oct 6, 2023
Hiring patterns for tech workers[1] in some of the largest metro areas have followed consistent trajectories from the start of the COVID-19 pandemic through 2022, but the current slowdown in the tech sector is hitting top metros differently.
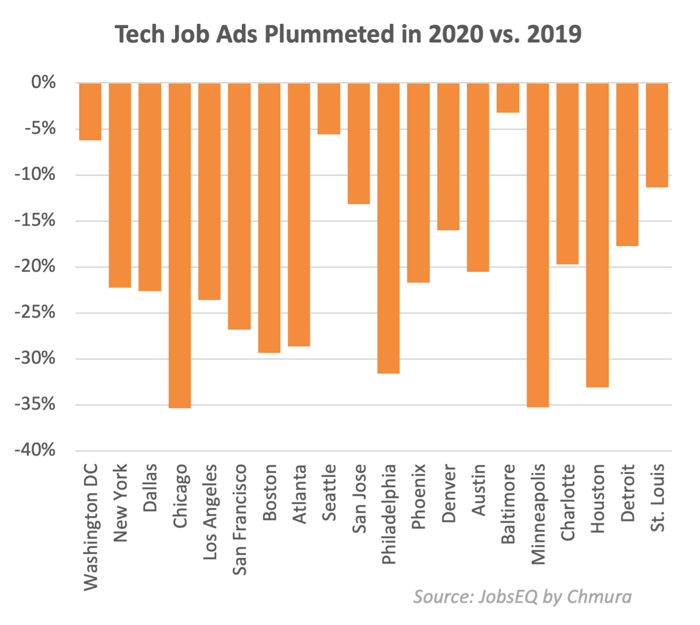
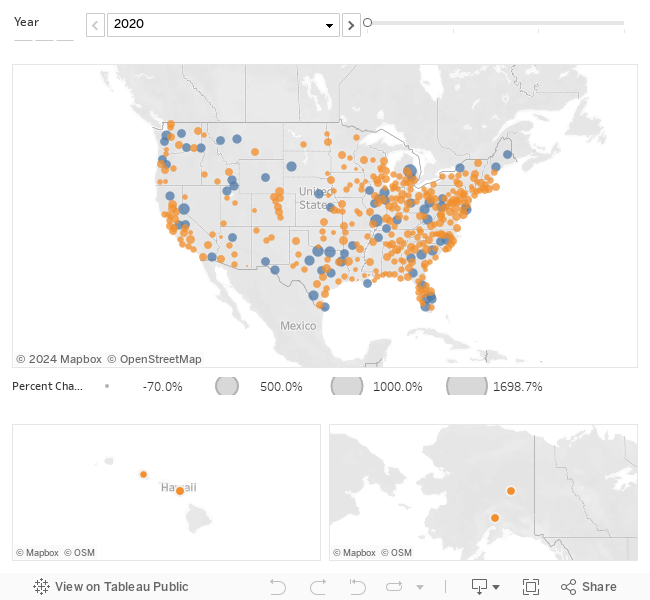
As pandemic uncertainty impacted hiring globally in 2020, average monthly job ad volume for tech workers fell in all of the top metro areas.[2] On average, the job postings—an early indicator of expected hiring—dropped 21% year over year. While all of the top areas experienced declines, the biggest change among this group was in Chicago and Minneapolis, both of which dropped 35%. Areas like Baltimore (-3%), Washington DC (-6%), and Seattle (-6%) proved more resilient but still had fewer openings for tech workers looking for a new opportunity. Though remote work opened up options outside of traditional tech locations, only two metros with an average of at least 1,000 ads per month saw an increase in 2020: Augusta, Georgia (+36%) and Ogden, Utah (+74%).
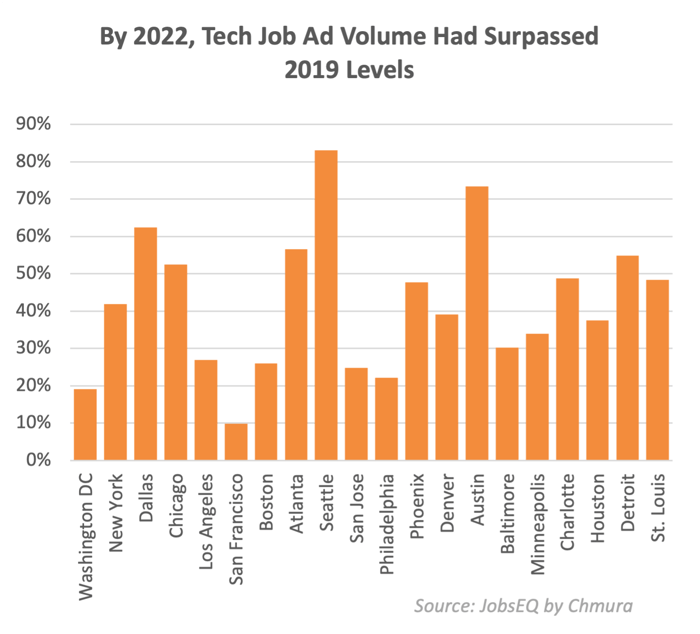
Despite the rapid decline in ads in 2020, tech hiring demand surged through 2022, as companies competed for top talent and recruited from a larger pool of candidates able to work remotely. Demand for tech talent surpassed 2019 levels in all of the top metro areas, and tech workers were more likely to find opportunities in traditional hubs like Seattle (83% more average monthly ads than in 2019) and Austin (+73%), as well as in locations such as Dallas (+62%), Atlanta (+57%), and Detroit (55%). While all of the top metros grew in 2022 compared with 2019 job ads, the slowest growth was in San Francisco (+10%), reflecting both the high pre-pandemic hiring in the area and some of the significant changes in company and worker location decisions due to the pandemic.
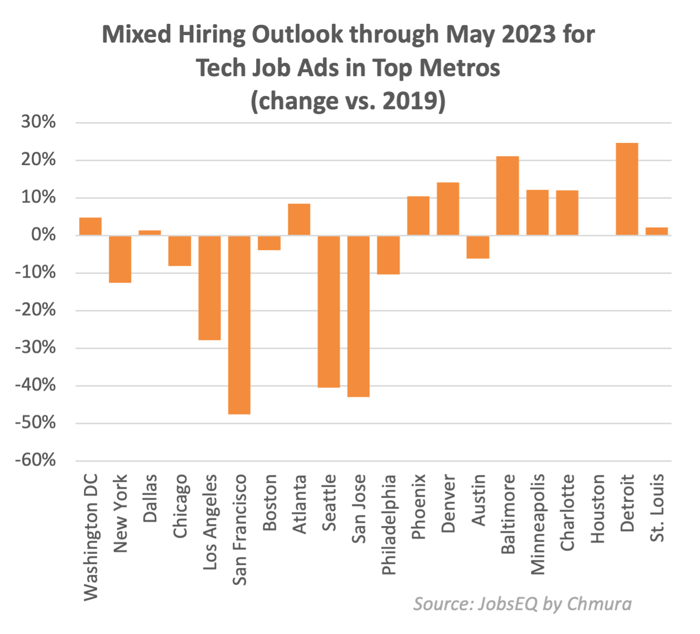
Are these metro areas still the best options for tech workers looking for a new job? The hiring picture for tech has changed significantly as the economy slows and headlines regularly feature layoffs. Through May 2023, job postings for the first time show differing trends for likely tech hires in the top metro areas. Compared with 2019 average monthly job ads through May, tech ad volume is down 48% in San Francisco, and is similarly lower in San Jose (-43%) and Seattle (-40%). However, several metro areas continue to show more ads this year than at the same time pre-pandemic, led by Detroit (up 25%). Other areas that continue to show resiliency during this time include Baltimore (+21%) and Denver (+14%).
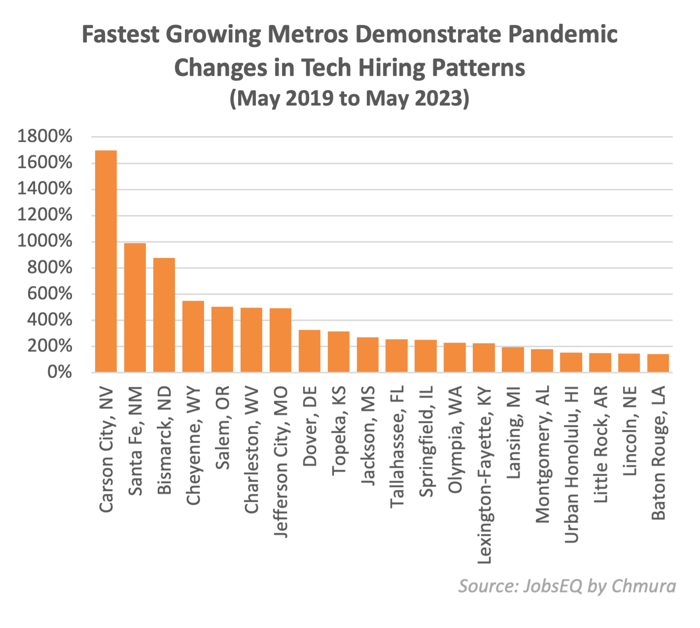
Tech workers in areas with declining job ads may want to look ahead to areas with growing opportunities. Among metros with at least an average of 1,000 job ads per month through May 2023, Carson City, NV has by far the fastest growth compared with its volume of tech ads in 2019. Ads are up nearly 1,700% in the metro, with major employers such as Meta, the State of Nevada, Oracle, Deloitte, and Intel continuing to post ads. Santa Fe, NM (+992%), Bismarck, ND (+876%), and Cheyenne, WY (+550%) are also showing significantly more demand for tech talent than before the pandemic.
As tech hiring trends begin to diverge among different metro areas, real time information from online job advertisements, such as the data compiled within JobsEQ platform, provide job seekers with insights into emerging markets and opportunities to get ahead of slowdowns and potential layoffs. While tech ads are slowing in many of the traditionally largest tech hubs, job seekers may need to expand their search to look to parts of the country which continue to benefit from pandemic migration and are continuing to hire. The interactive map below shows the change in tech job postings by metro area from 2019 through May 2023.
-------------------------------------------------------------
[1] Tech workers are defined by detailed Standard Occupation Classification (SOC) codes within the categories of computer occupations, business operations specialists, engineers, and managers.
[2] Areas analyzed are the top 20 Metropolitan Statistical Areas (MSAs) by total active ads between January 2019 and May 2023.


