|
Audience Use Cases
Built for the way your team works
|
JobsEQ Canvas · Included on All Licenses
One Canvas for Every Step of Your Work
Canvas brings analysis, visualization, collaboration, and reporting into one workspace inside JobsEQ. Ask a workforce or economic question, build the answer with your team, and publish the story, all without leaving the platform.






The Data Layer
Bring your own data into JobsEQ
Combine your organization's data with JobsEQ intelligence for more relevant, more specific analysis. Campus data, sales territories, program outcomes, local performance indicators, all combined with JobsEQ's labor market data in one workspace, without exporting to another BI tool.
✓
Combine JobsEQ intelligence with your team's own data in a single workspace
✓
Skip the export step and the second platform
✓
Update recurring deliverables in one place instead of rebuilding them each cycle
The Team Layer
Work on a canvas together, comment in place
Canvas is a shared workspace. Multiple team members can build on the same analysis at the same time, comment in place on any chart or map, and hand off without another platform. This is the first JobsEQ capability built for teams, not just individual analysts.
✓ Real-time collaboration inside JobsEQ
✓ Comment in place on any chart, map, or narrative
✓ Shared workspaces replace email chains, file versions, and disconnected spreadsheets
✓ Everyone works from the same source of trusted intelligence
✓ No new tool for your team to learn or your IT team to approve
The AI Layer
Ask the assistant to help build it
Describe what you need in plain language, and the assistant helps build the analysis, the visualization, or the report. Because it works from the JobsEQ data you already trust, its answers reflect your workforce intelligence, not a generic web crawl.
✓ Natural-language prompts for analysis, visualization, and reporting
✓ Grounded in the JobsEQ data you already use every day
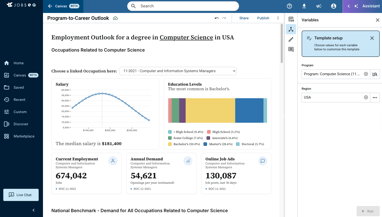
✓ Update a template with new data for a different industry, region, or project
✓ Turn a manager's ad-hoc question into a built answer in minutes
In Practice
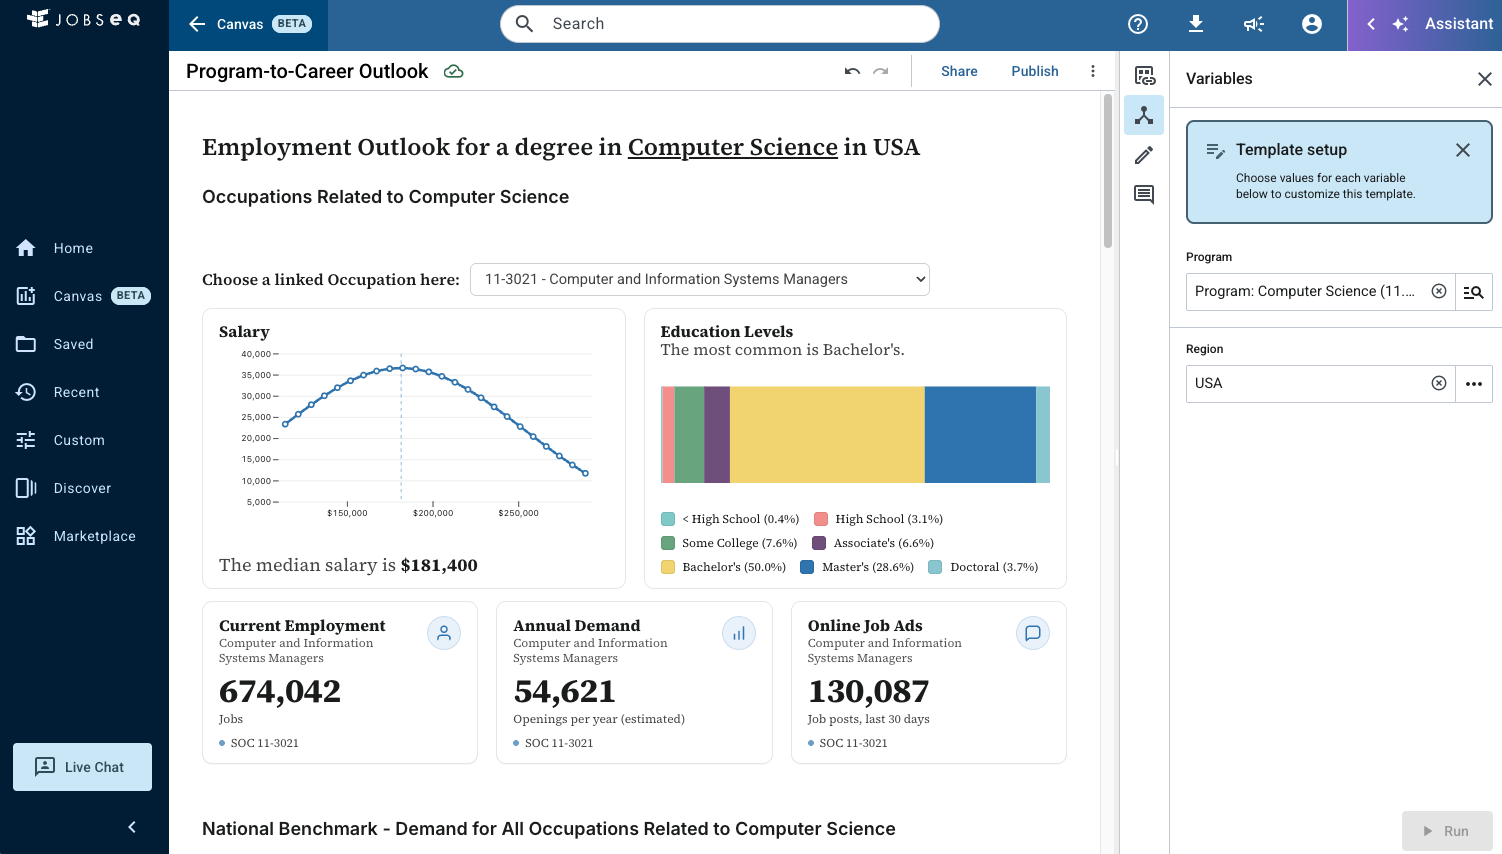
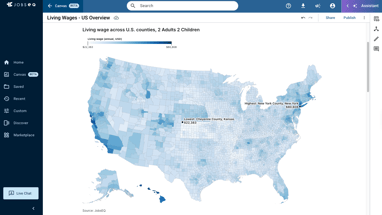
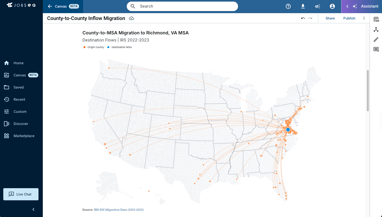
See what you can build with Canvas
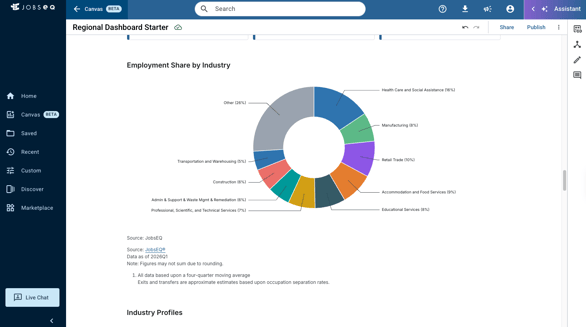
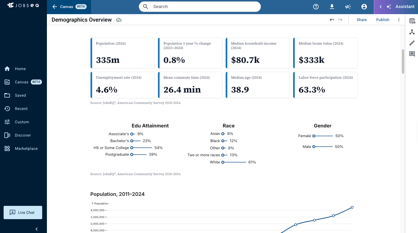
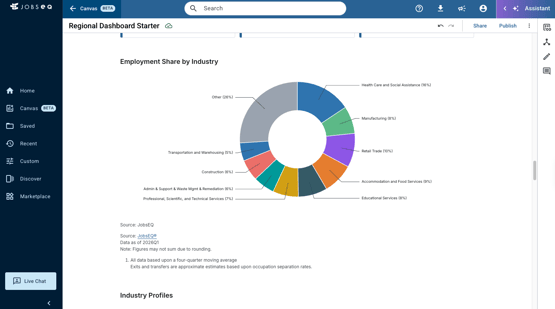
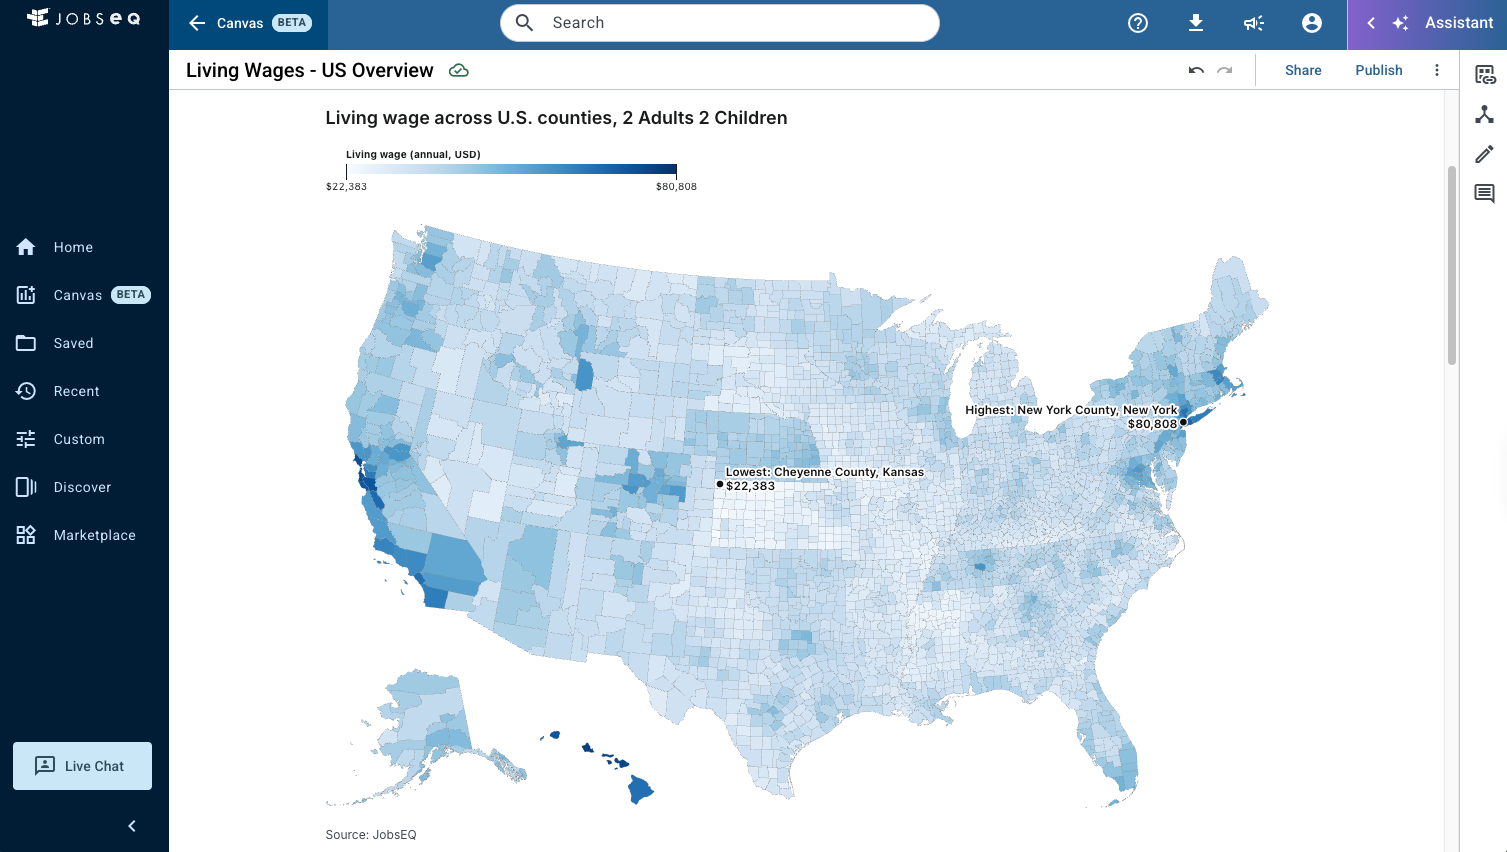
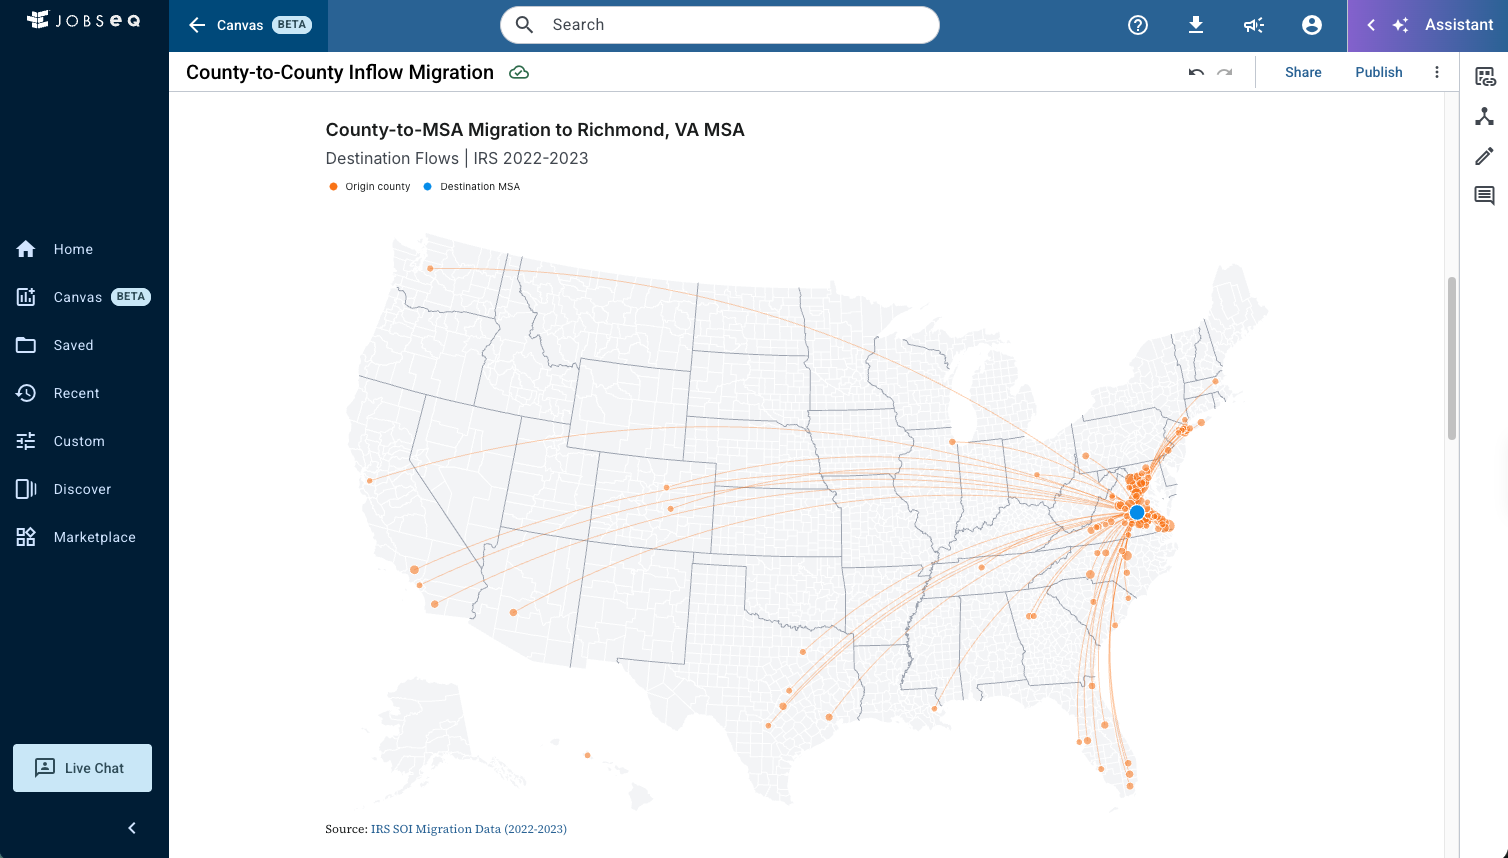
Plus workforce and awards reports, occupation comparison tables, career pathways, bubble maps based on location quotient, and any consolidated analysis your team can build.

Existing JobsEQ Users
Canvas removes the export step from the work you already do. Edit columns, build a chart, assemble an answer for a manager, all without leaving JobsEQ.

Economic Development
Public-facing dashboards for boards and community. Combine JobsEQ data, third-party sources, and local performance indicators in one workspace.

Education & CTE
Templates to start from, plus the ability to combine campus-level data with JobsEQ intelligence for accreditation, board reports, and grant workflows.

Workforce Development
Consolidated reporting for boards and funders, with occupation and industry forecasts in one place.

Corporate, HR, and Talent
Client-ready output produced without leaving the platform. Speed and consolidation for pay, hiring, and workforce planning.

Staffing, Consulting, and Site Selection
Presentation-ready client deliverables built inside JobsEQ. Combine JobsEQ intelligence with client data for defensible recommendations.