Census data reveal population shifts in urban neighborhoods and state-to-state displacements.
Covid-19
Data
Trends
By Chmura Economics & Analytics
Published Jun 8, 2021
Some reports have suggested urban neighborhood population losses due to the pandemic as well as some state-to-state displacements. The newly released Census data from “2019 to 2020” (which captures the population change from July 1, 2019 to July 1, 2020) identifies population movement during the first few months of COVID-19 within the country.[1] What do these Census data indicate about these possible trends?
Top Fifty Metropolitan Statistical Areas Rank Ordered by Population Growth Rate 2019-2020
|
MSA |
2020 Population |
Average Annual Growth 2017-2019 |
Growth Rate 2019-2020 |
|
Austin-Round Rock-Georgetown, TX |
2,295,303 |
2.6% |
3.0% |
|
Phoenix-Mesa-Chandler, AZ |
5,059,909 |
2.0% |
2.1% |
|
Raleigh-Cary, NC |
1,420,376 |
2.1% |
2.0% |
|
Las Vegas-Henderson-Paradise, NV |
2,315,963 |
2.1% |
1.8% |
|
Charlotte-Concord-Gastonia, NC-SC |
2,684,276 |
1.7% |
1.7% |
|
Jacksonville, FL |
1,587,892 |
1.8% |
1.7% |
|
San Antonio-New Braunfels, TX |
2,590,732 |
1.6% |
1.6% |
|
Dallas-Fort Worth-Arlington, TX |
7,694,138 |
1.6% |
1.6% |
|
Nashville-Davidson--Murfreesboro--Franklin, TN |
1,961,232 |
1.5% |
1.4% |
|
Tampa-St. Petersburg-Clearwater, FL |
3,243,963 |
1.4% |
1.4% |
|
Houston-The Woodlands-Sugar Land, TX |
7,154,478 |
1.2% |
1.3% |
|
Orlando-Kissimmee-Sanford, FL |
2,639,374 |
1.7% |
1.2% |
|
Oklahoma City, OK |
1,425,375 |
1.0% |
1.1% |
|
Seattle-Tacoma-Bellevue, WA |
4,018,598 |
1.1% |
1.0% |
|
Atlanta-Sandy Springs-Alpharetta, GA |
6,087,762 |
1.3% |
1.0% |
|
Denver-Aurora-Lakewood, CO |
2,991,231 |
1.2% |
0.9% |
|
Indianapolis-Carmel-Anderson, IN |
2,091,019 |
1.1% |
0.9% |
|
Riverside-San Bernardino-Ontario, CA |
4,678,371 |
0.9% |
0.8% |
|
Salt Lake City, UT |
1,240,029 |
1.1% |
0.8% |
|
Richmond, VA |
1,303,469 |
0.9% |
0.7% |
|
Portland-Vancouver-Hillsboro, OR-WA |
2,510,259 |
0.7% |
0.7% |
|
Columbus, OH |
2,138,946 |
1.0% |
0.6% |
|
Kansas City, MO-KS |
2,173,212 |
0.8% |
0.5% |
|
Minneapolis-St. Paul-Bloomington, MN-WI |
3,657,477 |
0.9% |
0.5% |
|
Sacramento-Roseville-Folsom, CA |
2,374,749 |
0.9% |
0.5% |
|
Washington-Arlington-Alexandria, DC-VA-MD-WV |
6,324,629 |
0.6% |
0.4% |
|
Average - Top 50 MSAs |
n/a |
0.6% |
0.4% |
|
Virginia Beach-Norfolk-Newport News, VA-NC |
1,779,824 |
0.3% |
0.3% |
|
Cincinnati, OH-KY-IN |
2,232,907 |
0.5% |
0.3% |
|
Louisville/Jefferson County, KY-IN |
1,268,993 |
0.2% |
0.2% |
|
Memphis, TN-MS-AR |
1,348,678 |
0.2% |
0.2% |
|
Miami-Fort Lauderdale-Pompano Beach, FL |
6,173,008 |
0.4% |
0.1% |
|
Birmingham-Hoover, AL |
1,091,921 |
0.2% |
0.1% |
|
San Diego-Chula Vista-Carlsbad, CA |
3,332,427 |
0.2% |
0.1% |
|
Philadelphia-Camden-Wilmington, PA-NJ-DE-MD |
6,107,906 |
0.2% |
0.1% |
|
Boston-Cambridge-Newton, MA-NH |
4,878,211 |
0.3% |
0.0% |
|
Providence-Warwick, RI-MA |
1,623,890 |
0.2% |
0.0% |
|
Milwaukee-Waukesha, WI |
1,577,676 |
0.1% |
0.0% |
|
St. Louis, MO-IL |
2,805,473 |
0.0% |
0.0% |
|
Baltimore-Columbia-Towson, MD |
2,800,189 |
0.1% |
-0.1% |
|
New Orleans-Metairie, LA |
1,272,258 |
0.1% |
-0.1% |
|
Buffalo-Cheektowaga, NY |
1,125,637 |
-0.1% |
-0.2% |
|
Cleveland-Elyria, OH |
2,043,807 |
-0.2% |
-0.3% |
|
Hartford-East Hartford-Middletown, CT |
1,201,483 |
-0.1% |
-0.3% |
|
Detroit-Warren-Dearborn, MI |
4,304,136 |
0.0% |
-0.4% |
|
Pittsburgh, PA |
2,309,246 |
-0.3% |
-0.4% |
|
Chicago-Naperville-Elgin, IL-IN-WI |
9,406,638 |
-0.3% |
-0.5% |
|
Los Angeles-Long Beach-Anaheim, CA |
13,109,903 |
-0.3% |
-0.6% |
|
New York-Newark-Jersey City, NY-NJ-PA |
19,124,359 |
-0.2% |
-0.6% |
|
San Francisco-Oakland-Berkeley, CA |
4,696,902 |
0.1% |
-0.6% |
|
San Jose-Sunnyvale-Santa Clara, CA |
1,971,160 |
-0.2% |
-0.7% |
|
Source: Census Population Estimates Program |
|||
Overall, the fifty largest metro areas averaged 0.6% annual growth from 2017 through 2019 and that slowed slightly to 0.4% in 2020. The fastest growing metros, shown at the top, continued to grow at a quick pace in 2020. Among the top twelve, the two with the largest slowdowns were Las Vegas and Orlando, not surprising being that travel and entertainment were both hit hard early in the pandemic and both regions have entertainment-heavy economies. The three largest metros—Chicago, Los Angeles, and New York—all landed in the bottom five with the largest percentage population declines from 2019 to 2020. San Francisco and San Jose also joined these in the bottom five, highlighting the overall population decline in California this past year.
Year-over-Year Population Changes: Five Largest MSAs and Their Central Counties
|
2018 |
2019 |
2020 |
|
|
New York-Newark-Jersey City, NY-NJ-PA MSA |
-0.2% |
-0.3% |
-0.6% |
|
Bronx County, New York |
-0.5% |
-1.0% |
-1.2% |
|
Kings County, New York |
-0.6% |
-0.7% |
-0.9% |
|
New York County, New York |
0.0% |
0.0% |
-1.2% |
|
Queens County, New York |
-0.9% |
-0.9% |
-1.2% |
|
Los Angeles-Long Beach-Anaheim, CA MSA |
-0.2% |
-0.4% |
-0.6% |
|
Los Angeles County, California |
-0.3% |
-0.5% |
-0.7% |
|
Chicago-Naperville-Elgin, IL-IN-WI MSA |
-0.3% |
-0.3% |
-0.5% |
|
Cook County, Illinois |
-0.5% |
-0.5% |
-0.7% |
|
Houston-The Woodlands-Sugar Land, TX MSA |
1.1% |
1.3% |
1.3% |
|
Harris County, Texas |
0.5% |
0.7% |
0.6% |
|
Dallas-Fort Worth-Arlington, TX MSA |
1.6% |
1.6% |
1.6% |
|
Dallas County, Texas |
0.4% |
0.2% |
0.0% |
|
Source: Census Population Estimates Program |
|||
The Census Population Estimates data are not at the neighborhood level, so cannot prove trends for those urban geographies. However, looking at county-level data within the largest MSAs, we largely see the continuation of a pre-pandemic trend. Within these MSAs, the central counties were seeing slower population growth compared to their overall metro areas—or more specifically in the largest three metros, larger declines than in the MSA overall. The one exception to this is Manhattan (New York County), which was approximately flat the previous two years before registering a 1.2% decline in 2020—the population exodus from this borough since the beginning of the pandemic was well publicized, along with a related plummet in its rental prices.
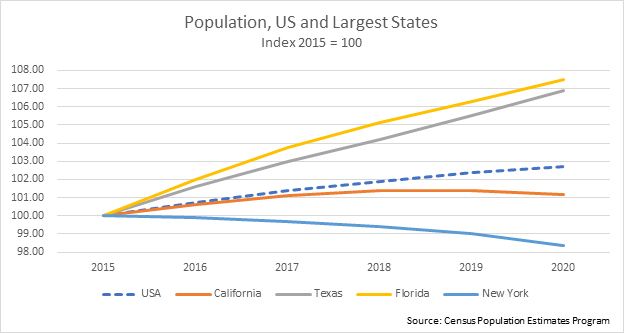
Among the four largest states, Texas and Florida have both exhibited above-average population growth over the past five years, and that continued last year unabated. New York, however, has been in decline, and that decline accelerated in 2020. California population had been expanding up through 2018, but the growth stalled in 2019 and turned downward in 2020. For both New York and California over the past several years, international in-migration has slowed while domestic out-migration has increased.
Unrelated to the pandemic, but another trend to note from the newest population release is the continued decline in the U.S. birth rate. The number of births peaked at 3.99 million in 2015[2] and have steadily declined since. There were approximately 3.75 million births in 2020, 6.1% lower than the peak five years earlier.
|
USA |
|||
|
Year |
Population |
Births |
Birth Rate (per 1000 population) |
|
2010 |
309,327,143 |
n/a |
n/a |
|
2011 |
311,583,481 |
3,973,485 |
12.8 |
|
2012 |
313,877,662 |
3,936,976 |
12.5 |
|
2013 |
316,059,947 |
3,940,576 |
12.5 |
|
2014 |
318,386,329 |
3,963,195 |
12.4 |
|
2015 |
320,738,994 |
3,992,376 |
12.4 |
|
2016 |
323,071,755 |
3,970,959 |
12.3 |
|
2017 |
325,122,128 |
3,890,144 |
12.0 |
|
2018 |
326,838,199 |
3,835,477 |
11.7 |
|
2019 |
328,329,953 |
3,770,397 |
11.5 |
|
2020 |
329,484,123 |
3,748,000 |
11.4 |
|
Source: Census Population Estimates Program |
|||
[1] The Census “Population Estimates Program” produces year-to-year estimates of the U.S. population. The Vintage 2020 estimates do not incorporate results from the 2020 Census, nevertheless, they provide a valuable look at recent trends. The 2020 data are estimates as of July 1, 2020.
[2] The births for a given year are for the twelve months ending July 1 of the shown year. Thus, the 2015 births are for the twelve months ending July 1, 2015.


