Since the beginning of the pandemic lockdowns in March 2020, the percentage of people working remotely has more than doubled based on job postings.
Data
Forecasting
Economy
JobsEQ
Trends
Analysis
Consulting
Staffing
Plus
Pro

By James Stinchcomb
Published Apr 11, 2022
To allow users to monitor remote jobs and provide additional insight into their local job market, Chmura has recently released remote job identification as a new feature in the JobsEQ RTI analytic. For classification purposes, remote jobs are any job that has been identified as having any type of remote work – including fully remote job, hybrid remote, or temporary remote jobs.[1]
Remote Job Trends
Since the beginning of the pandemic lockdowns in March 2020, the percentage of people working remotely has more than doubled based on job postings. Even so, the latest job postings show that the metro area with the highest remote work as a percent of total ads is less than 10%. Despite the decline in working from home in recent months as pandemic fears eased, more people will be working from home when compared with pre-Covid times.
 Click on the image to enlarge it in a new window.
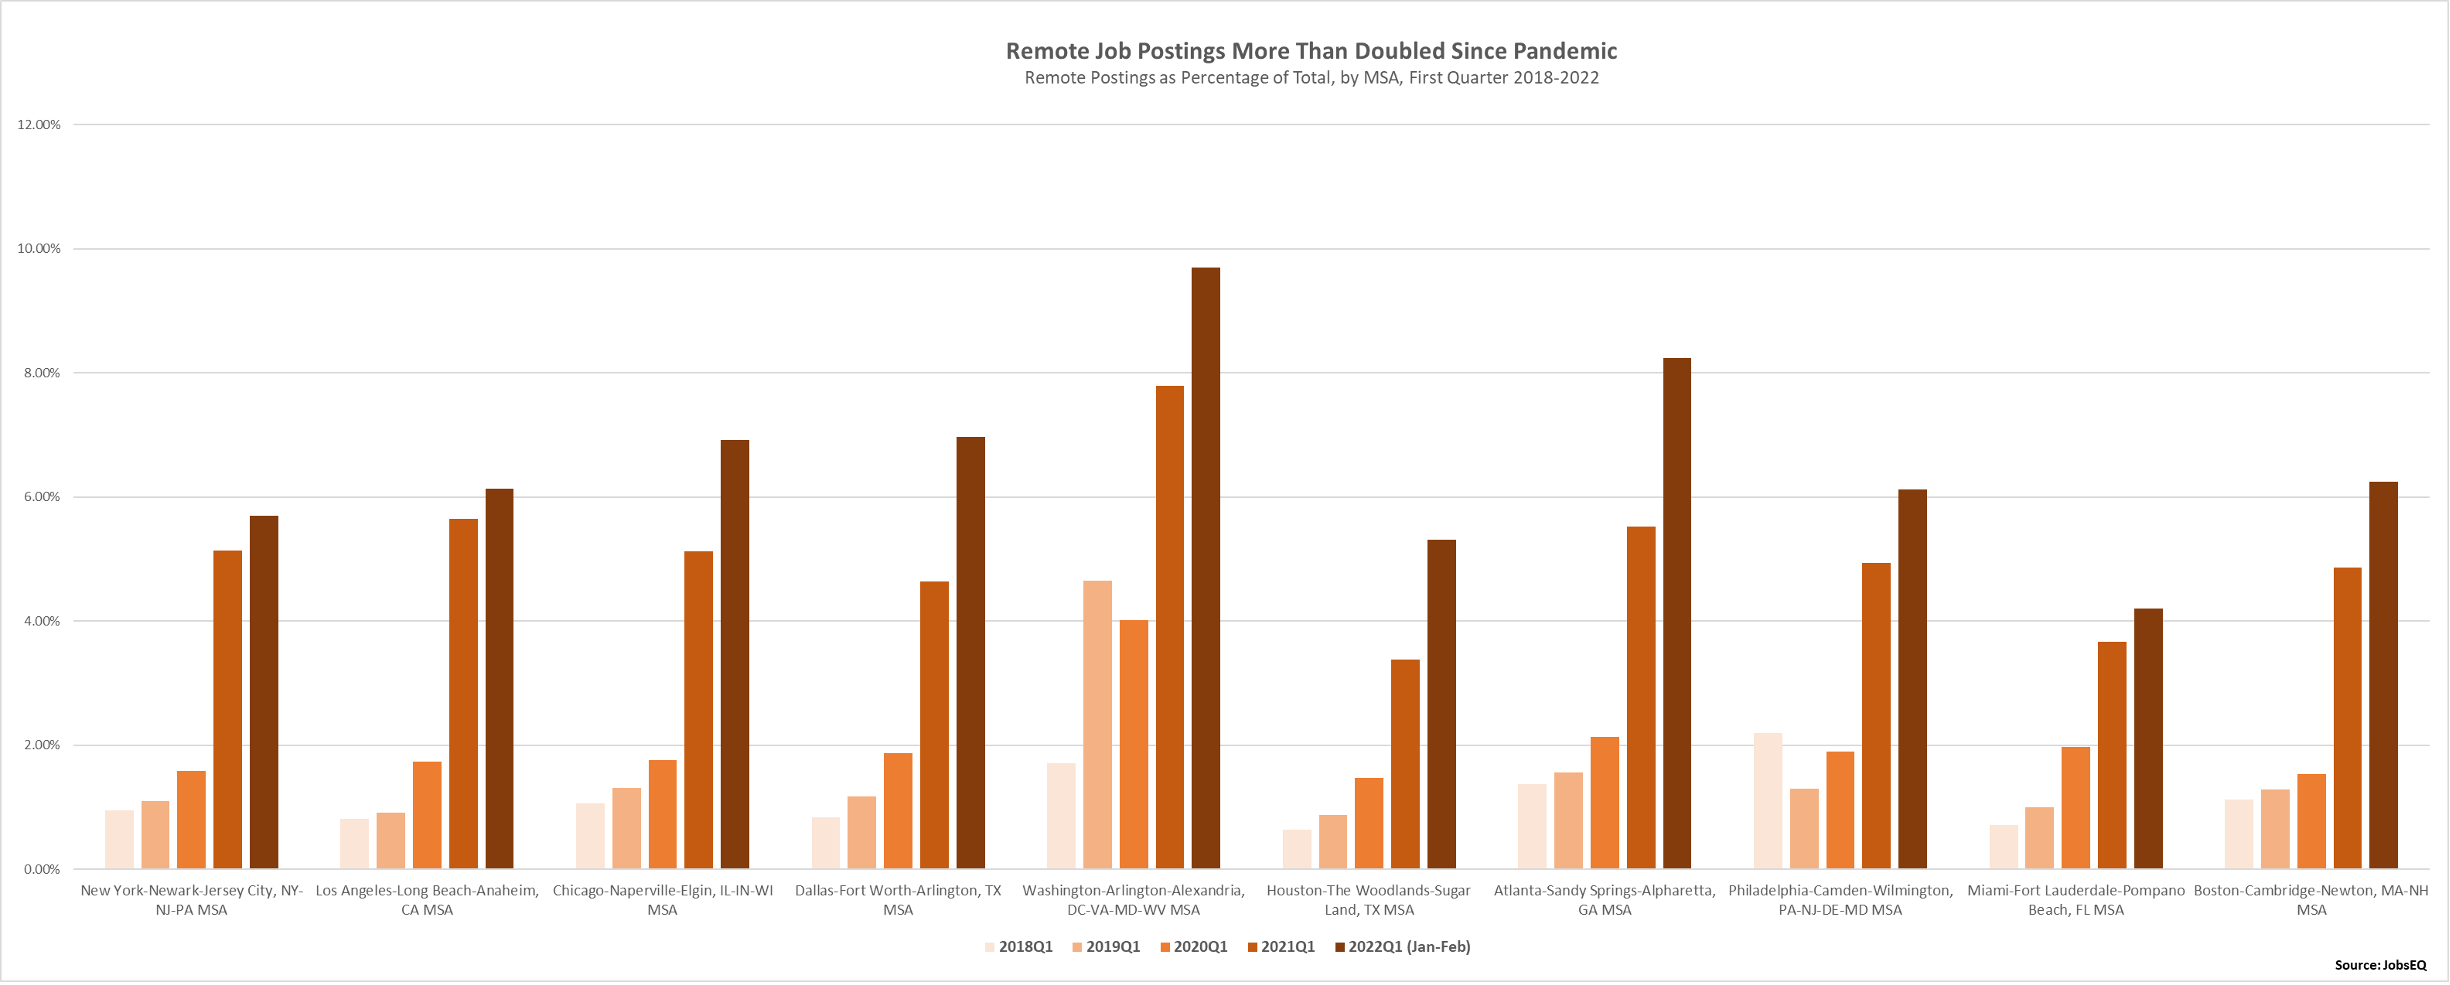
The chart above shows the percentage of all job postings that are remote for the first quarter of each year, 2018 through 2022 (Jan-Feb of ‘22) for each of the ten largest MSAs (metropolitan statistical areas).[2] In most regions, remote jobs were less than 2% of total postings from 2018Q1 through 2020Q1, right before most lockdowns began, with a low of 0.6% in 2018Q1 in the Houston MSA. In 2021Q1 and 2022Q1, the rate of remote postings more than doubled, going above 4% in each MSA except Miami and Houston in 2021Q1 and hitting 6% or higher in most of the MSAs in 2022Q1. On the two opposite ends of the spectrum are the Washington DC MSA, which typically had a higher percentage of remote jobs than the other large MSAs and hit 9.7% in 2022Q1, and the Miami MSA, which peaked at 4.2% in 2022Q1. Out of all 384 MSAs in the country, 334 saw the number of remote job postings, as a percentage of the total, at least double between 2020Q1 and 2022Q1. Of the 50 largest, all more than doubled their remote job count over the same period.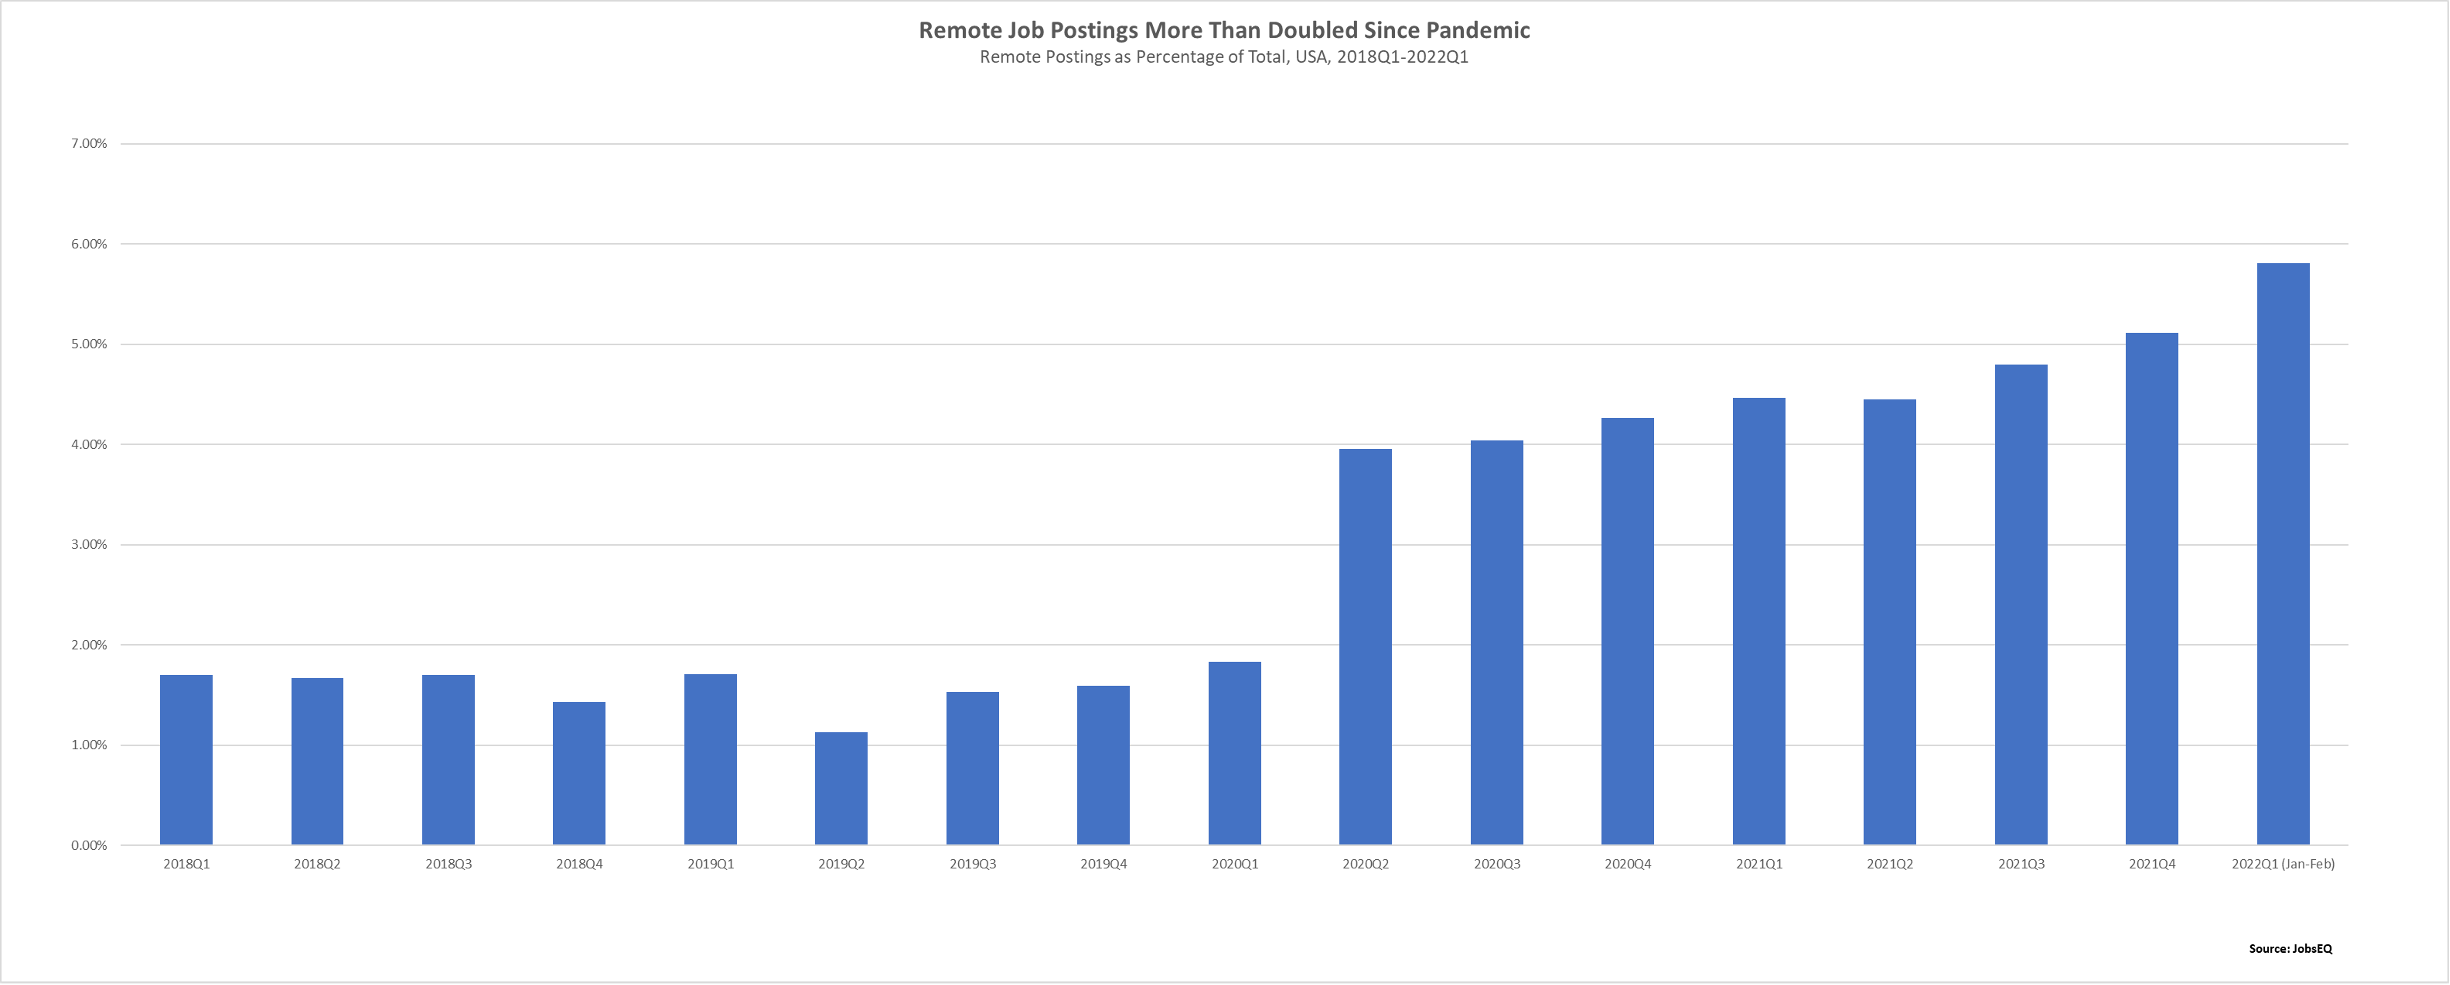 Click on the image to enlarge it in a new window.
For the United States, after the percentage of remote job postings doubled at the onset of the pandemic lockdowns, the percentage has continued to rise almost every quarter, reaching 5.8% in 2022Q1. This may seem contradictory to the fact that many companies and workers have begun returning to the office, especially in the last two quarters. One explanation is that, in the tight labor market, employers are more likely to actively promote remote work as a differentiator and key benefit potential employees look for when searching for a job. It’s also possible that while workers are returning to the office, they are doing so in a hybrid remote situation, where they work from the office on some days and remotely on others. With the current labor market strongly favoring workers right now, employers must work harder to attract talent, and offering remote work, even as hybrid remote, is one benefit that has gained importance to some workers. In future analyses, we will continue to explore whether remote job postings rise further, level off, or decrease as more companies return to the office throughout the year.
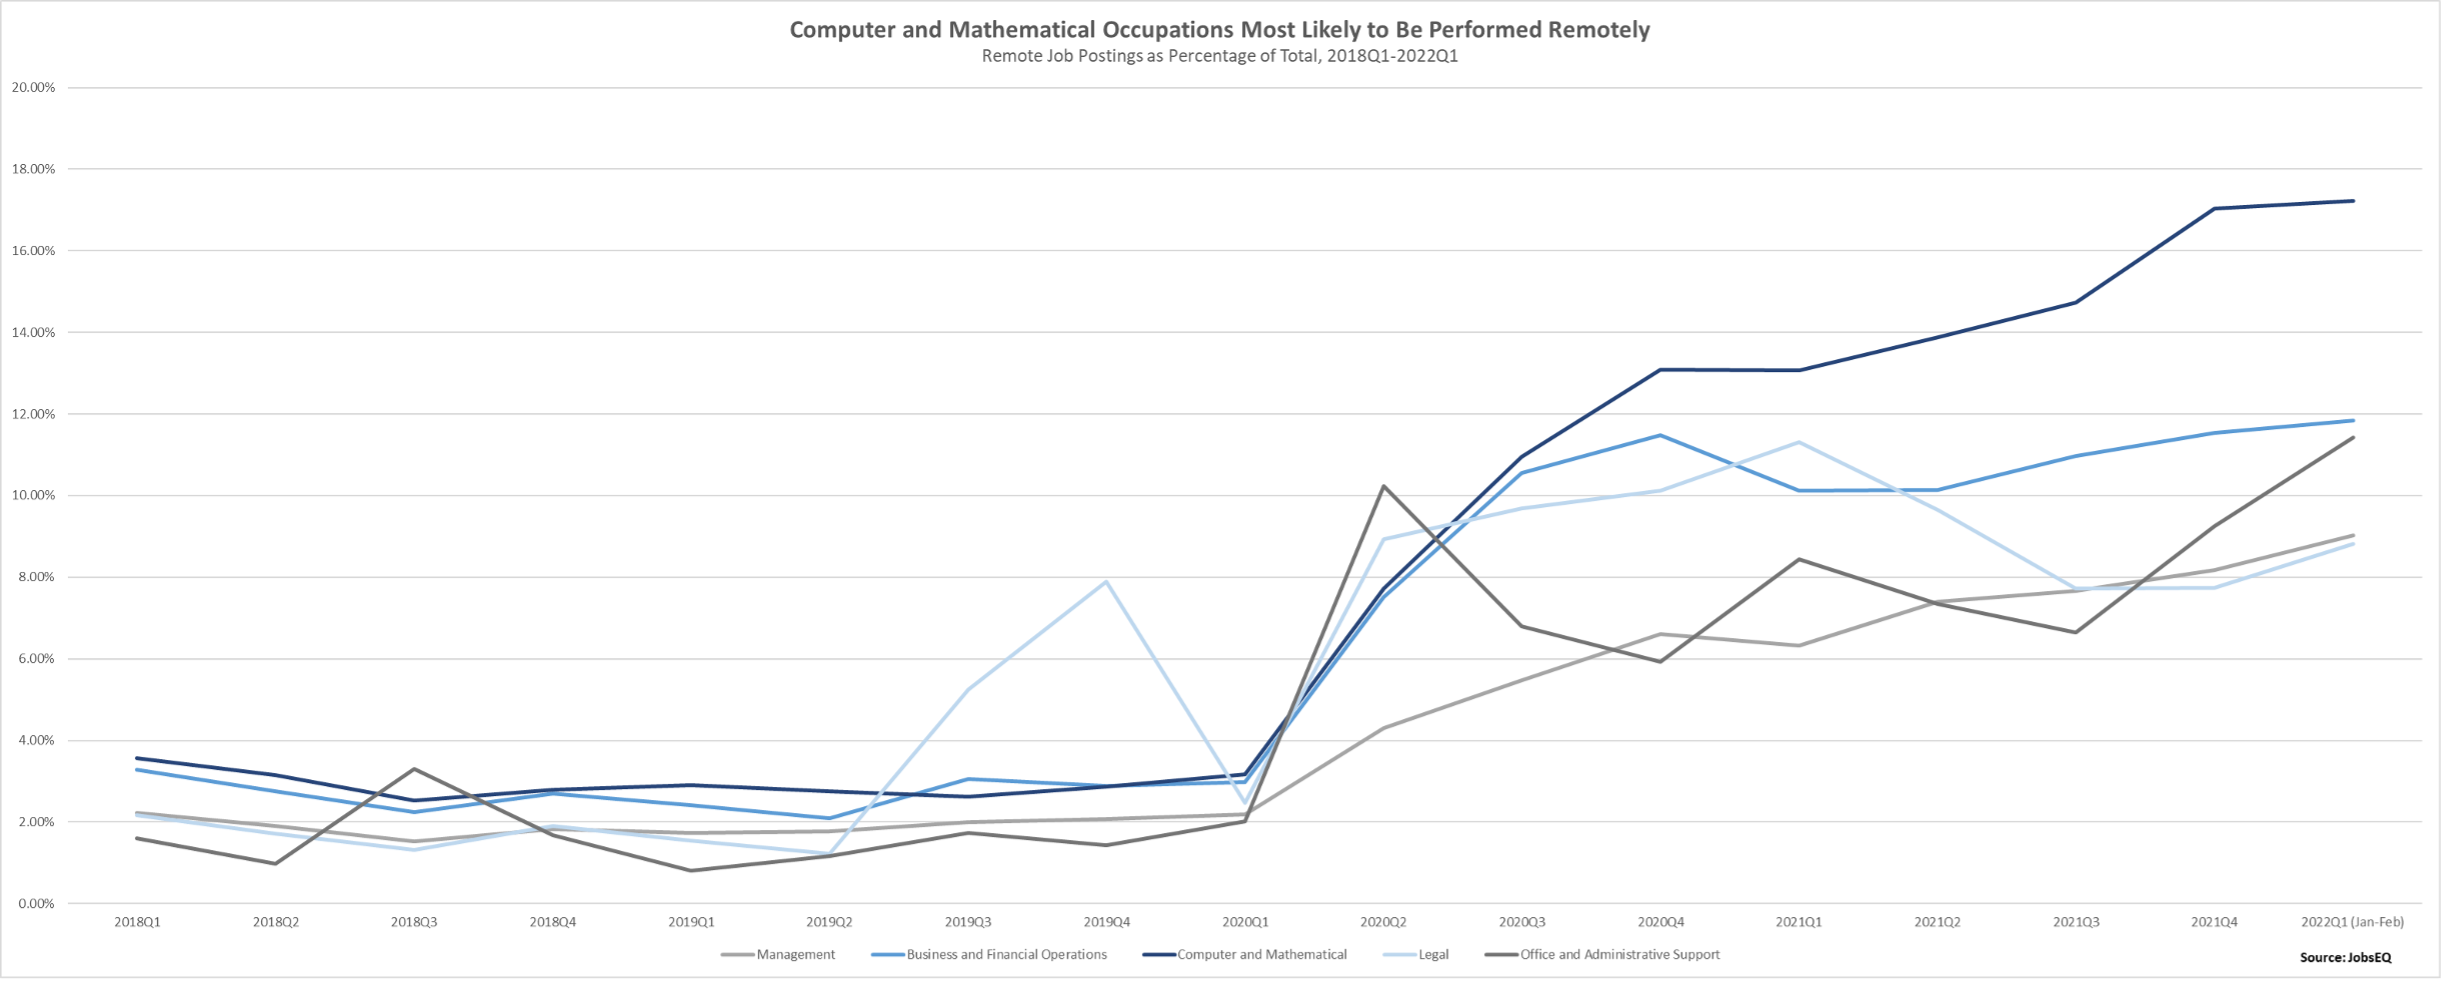
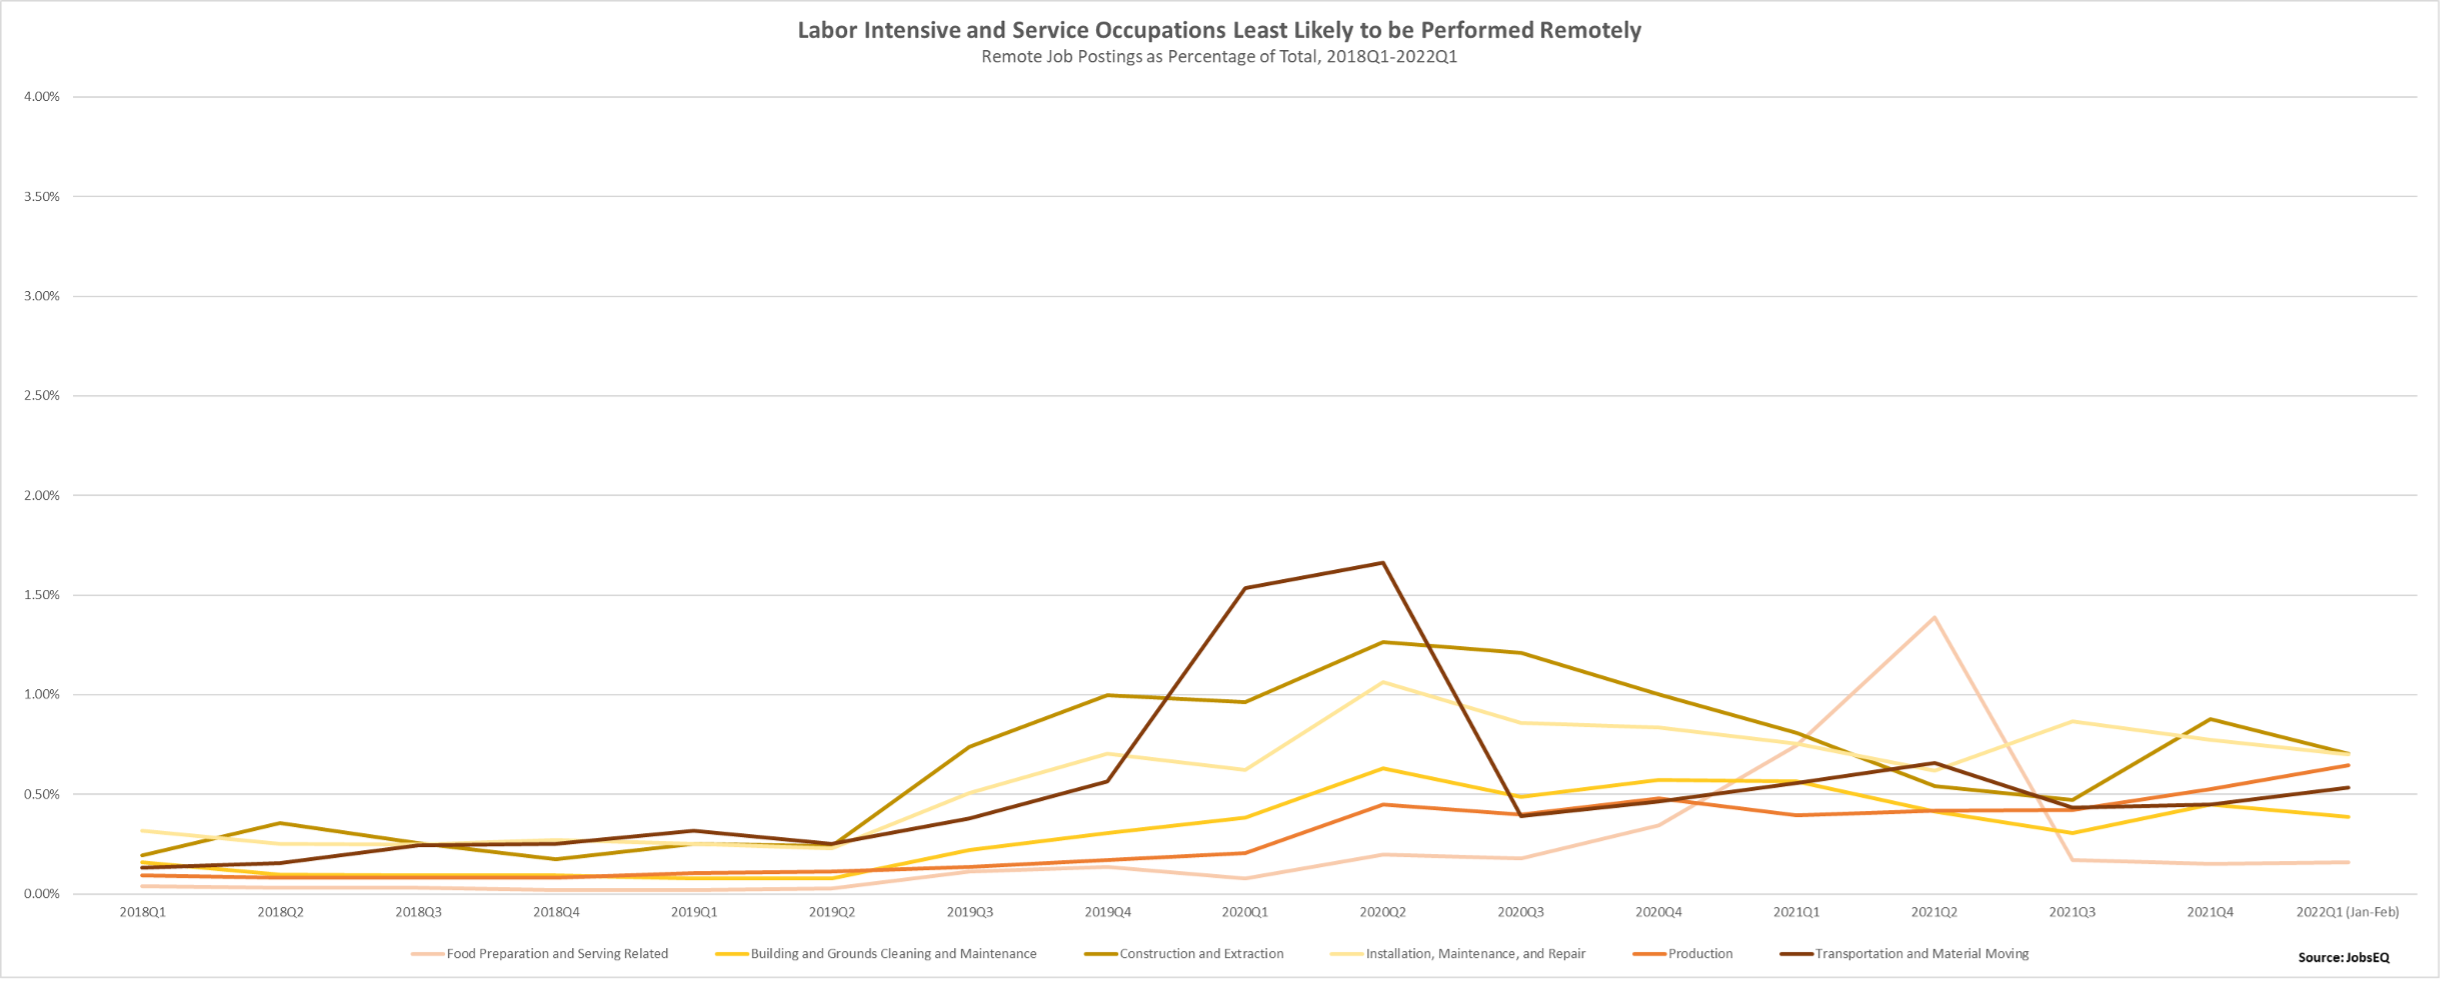
Moving to the occupation level, there is a very noticeable trend differentiating those broad occupation groups that can and are likely to be performed remotely and those that are much less likely to be remote. The next two charts show the five broad occupation groups with the largest increase in remote job postings since the beginning of the pandemic and those that saw the least change.
 Click on the image to enlarge it in a new window.
 Click on the image to enlarge it in a new window.
The five occupation groups with the largest increases in remote work job ads are dominated by occupations where work is largely done on a computer or where teleconferencing is possible, making for a relatively easy transition to remote work. As can be seen in the charts, occupation groups including Management, Business and Financial Operations; Computer and Mathematical; Legal; and Office and Administration Support all saw dramatic increases in the percentage of remote job postings, averaging between 1% and 3.5% prior to the pandemic to each reaching 9% or higher in at least one quarter following the start of the pandemic lockdowns. Computer and Mathematical occupations saw the highest remote postings—above 17% in 2022Q1.
The six occupation groups with little change, on the other hand, consist mostly of occupations that are either labor intensive, requiring physical labor onsite, or are service occupations that require in-person contact. Unsurprisingly, these occupations were also some of the hardest hit occupations during the pandemic shutdown, particularly the Food Preparation and Service occupations. Specifically, the occupation groups of Food Preparation and Serving; Building and Grounds Cleaning and Maintenance; Construction and Extraction; Installation, Maintenance, and Repair; Production; and Transportation and Material Moving all saw relatively little change in remote work job ads. Most of these occupations peaked in the quarter immediately following the start of lockdowns, and fell in more recent quarters, each settling below 1% in the last few quarters.
Remote Work Designations in JobsEQ
As a next step in our remote occupation analysis, Chmura will be incorporating RTI data into our remote occupation classifications, where we identify which detailed occupations are likely to be remote or not. This will be discussed in an upcoming blog and explored in future projects.
[1] This includes “remote” work that is not equivalent to work at home, such as “field work.” In the future, we plan to incorporate remote “types” in order to differentiate between these variations where possible.
[2] In this article, note that only remote jobs with a known location (classifiable by county) associated with the posting are being included. Postings listed as remote with no associated location are excluded; however, these postings account for a very small fraction, less than 1%, of total remote postings.


