What trended in the workforce in 2022 and what does that hold for 2023? This article explores that question using the RTI jobs ad dataset from JobsEQ.
Workforce
Data
Economy
JobsEQ
Trends
Analysis
Staffing
By Chmura Economics & Analytics
Published Jan 11, 2023
What trended in the workforce in 2022 and what does that hold for 2023? This article explores that question using the RTI[1] jobs ad dataset from JobsEQ.
The Overall Market
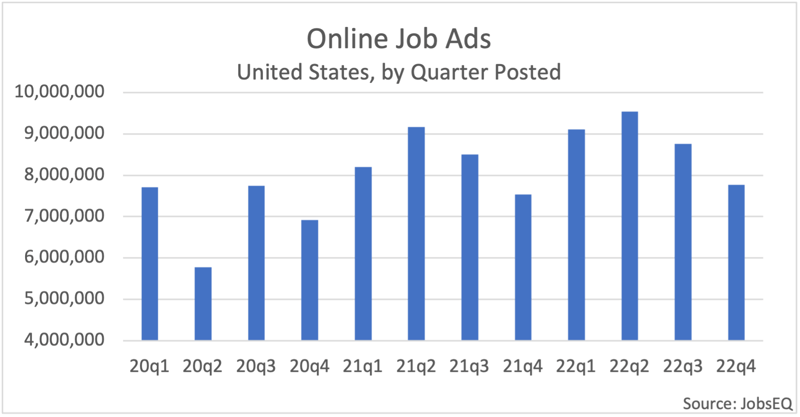
New online job ad volume reached a peak in the second quarter of 2022 at 9.5 million ads. Overall volume in 2022 was about 5% higher than in 2021. In the second half of 2022, the volume of new job ads trailed off of the second quarter peak, however, the rate of decline in the third and fourth quarters was similar to the seasonal pattern followed in 2021. It is therefore not clear that this drop in volume in the second half of the year was a signal of a coming slowing in the economy as opposed to being tied to seasonal hiring patterns.
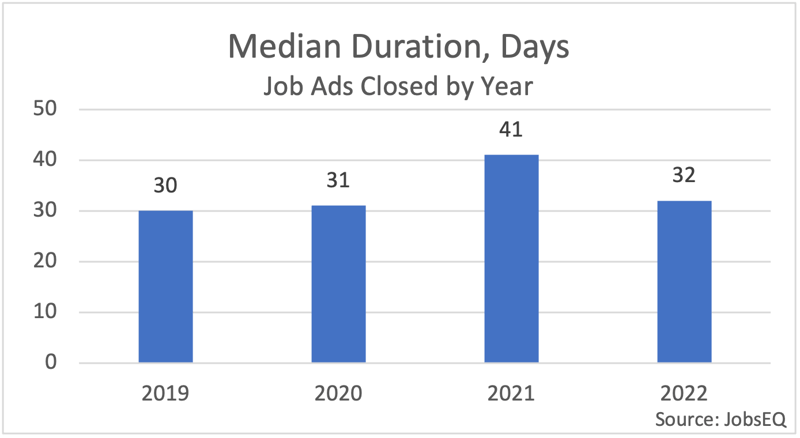
Job ads being open for shorter timeframes, however, can be an indicator of jobs being filled quicker due to more competition and fewer opportunities per job seeker. The median duration of job ads closed dropped dramatically in 2022 to 32 days from 41 days in 2021. However, the median duration in 2022 is fairly close to the median durations in 2019 and 2020, suggesting 2021 was the outlier with an especially tight labor market.
Occupation Trends
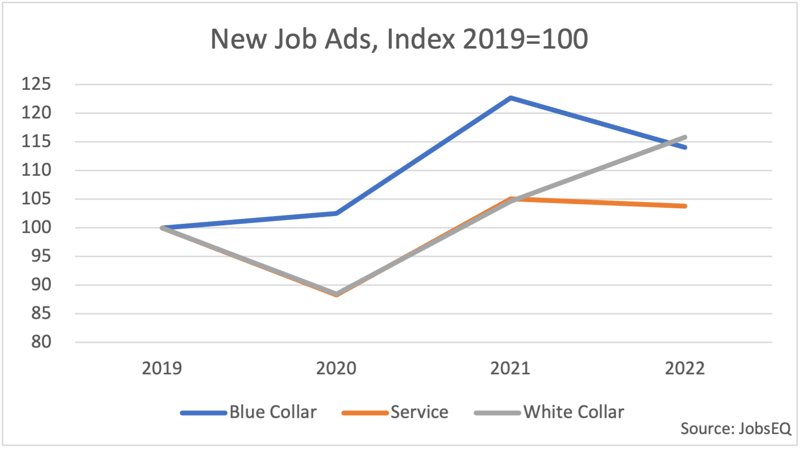
With the onset of the pandemic, a major shift occurred in hiring, partially due to the lockdown and its effects, such as the shift in retail to electronic shopping which required an increase in delivery and warehousing workforce. This can be seen in the above chart in the increased demand for blue-collar jobs in 2020 and 2021 compared to white-collar and service occupations.[2] Another shift occurred in 2022 with white-collar job ads growing substantially while service jobs were about flat and blue-collar ads pulled back.
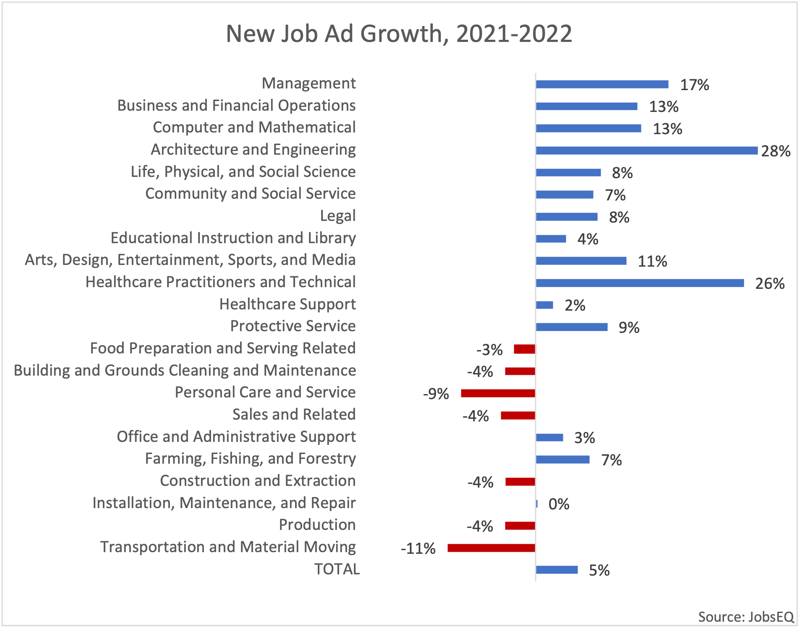
At the 2-digit SOC[3] level, the sharpest increases in job ads in 2022 were for architecture and engineering positions (+28%) and healthcare practitioners and technical occupations (+26%). The largest rates of decline in 2022 relative to 2021 were in ads for transportation and material moving (-11%) and personal care and service (-9%). At the 8-digit SOC level, occupations with the largest increases in new ads this last year were led by registered nurses, computer and information systems managers, software developers, management analysts, and licensed practical and licensed vocational nurses. Largest declines over the same period featured retail salespersons, stockers and order fillers, heavy and tractor-trailer truck drivers, drivers/sales workers, and restaurant cooks.
According to Bureau of Labor Statistics employment projections for 2021 through 2031,[4] the healthcare support group and computer and mathematical occupations will be among the fastest growing whereas production jobs and office and administrative support positions will have the largest declines. Short-term demand from job ads are an excellent early indication to gauge how these long-term expectations may play out.
Other Data Possibilities
Though service occupations did not see an overall increase in new ads in 2022, demand for these positions was competitive as evidenced by a relatively high increase in wages for these jobs. Per wages offered in job ads, the following occupations all had double-digit median wage increases in 2022 compared with 2021: waiters and waitresses, fast food and counter workers, dining room and cafeteria attendants and bartender helpers, dishwashers, and maids and housekeeping cleaners.
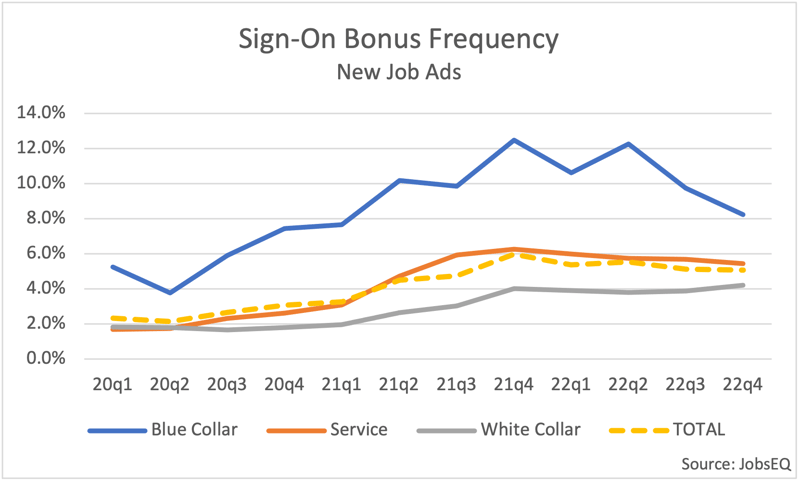
An increase in the practice of offering sign-on bonuses is also a sign of a tight labor market. The offering of sign-on bonuses increased in popularity following the pandemic along with a rise in wages. In 2022, however, sign-on bonuses declined in popularity after peaking in the fourth quarter of 2021, which may be an indicator of slowing hiring competition. Some of the overall decline, however, can be attributed to the decrease in ads for truck drivers in 2022, a popular occupation in job ads and one with a high-prevalence of sign-on bonuses. Nevertheless, sign-on bonuses also slowed among service occupations during this period, slipping from 6.3% in the fourth quarter of 2021 to 5.4% in the fourth quarter of 2022. Sign-on bonuses for white-collar occupations inched up over the same period from 4.0% to 4.2%.
Hot Skills
Hot Skills 2022
| Customer Relationship Management (CRM) |
Tableau |
| Data Analysis |
Epic Systems |
| Change Management |
Computer Aided Design Software (CAD Software) |
| Microsoft Azure |
Advertising |
| Statistics |
Kubernetes |
| Scrum |
Team Leadership |
| Microsoft Sharepoint |
Microsoft Power BI |
|
Atlassian JIRA |
Asset Management |
Source: JobsEQ
The hard skills in the above list are popular and fast-growing skills according to the online job ads data; they are also good bets to continue to be in high-demand in 2023 based on their past performances. These skills each grew at least 25% in each of the past two years as well as averaged at least 100,000 appearances in unique job ads in these years.
Remote Work
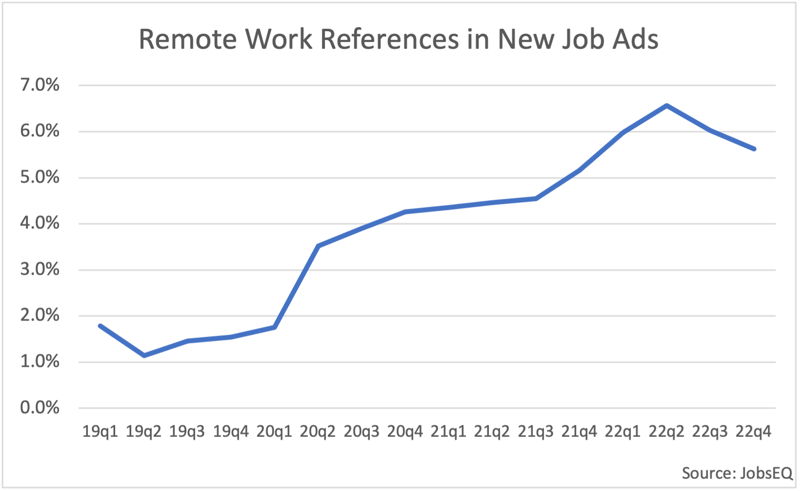
The prevalence of remote work[5] jumped with the onset of the pandemic lockdown. Mentions of remote work in job ads peaked in the second quarter of 2022, declining in the second half of the year. This job benefit varies greatly by occupation, appearing in less than one percent of ads for blue collar workers and most frequent in the computer and mathematical occupation group, appearing in 21.0% of ads in 2022. A variety of 8-digit occupations had remote work benefits mentioned in more than 30% of jobs ads in 2022, led by the following: tutors, data entry keyers, health information technologists and medical registrars, database architects, biostatisticians, data warehousing specialists, and computer network architects.
About the Data
All job postings data above are derived from the Real-Time Intelligence online job ad data set, pulled from over 45,000 websites and updated daily. Historical volume is revised as additional data are made available and processed. Each month of ads is defined as new online ads that first appeared in that month. All ad counts represent unique, “deduplicated” figures. The relationship between ad counts and actual hires is described here.
Sign-on bonus offers in the ads data cited above were identified via the presence of one of several keyword phrases: “sign-on bonus,” “hiring bonus,” “starting bonus,” or “signing bonus.” If sign-on bonuses were indicated in the job ads with some other verbiage, or were not indicated at all, any presence of these bonuses for those jobs are not captured in the data above.
Skills and wage data wholly reflect explicit job ad references only. In other words, only wages directly listed in job ad text are included in the wage analysis; likewise, only skill requirements explicitly requested in the job ad are included in the dataset used for this blog.
-----------
[1] RTI stands for Real-Time Intelligence. See data notes at end of this article for further details.
[2] White-collar jobs are defined as those in SOC codes beginning 11-29 and 41-43, blue-collar jobs are those beginning with 45-53, and service jobs are the remaining occupations beginning with 31-39.
[3] SOC stands for the Standard Occupational Classification.
[5] “Remote work” here includes any type of remote work, including hybrid/partial-remote situations.


