One thing we at Chmura take pride in is hearing our clients praise our accurate data, a difference they notice relative to other economic data sets.
Covid-19
Data
Forecasting
JobsEQ
Trends
Analysis
Pro
By Chmura Economics & Analytics
Published Jul 26, 2021
Accuracy matters with labor market datasets
One of the things we at Chmura take pride in is hearing our clients praise the accuracy of our data, a difference they notice relative to other economic data sets they’ve seen. We’re happy to hear this because it means we’re meeting our clients’ standards—we’re helping them meet their goals. But also, it is affirming in that it justifies the extraordinary efforts we put into producing our data. An example of this extra effort is how we approach forecasting within JobsEQ, our regional labor market data platform.
Getting a more accurate forecast
Our job forecasts begin with long-term growth expectations at the national level, for which we look to the experts at the Bureau of Labor Statistics (BLS) and their annually updated industry and occupation projections. We bring these forecasts down to the regional level, staying true to the BLS projections but with adjustments[1] for local conditions.
We typically emphasize providing long-term projections (as opposed to short-term) in JobsEQ because that extended outlook most closely matches the needs of our clients—for example, those in workforce and education who provide guidance on long-term career options. However, the COVID pandemic brought unprecedented changes to job growth expectations. The short-term economic disruption was so large that looking forward without accounting for the pandemic shut-downs was unsound. In this climate, it was critical that we help our clients with a short-term jobs forecast to improve the accuracy of the employment projections compared to relying solely on a long-term, ten-year forecast.
While we don’t own a crystal ball, we do have two Blue-Chip economists on our team. We’ve also regularly kept our fingers on the pulse of the U.S. economy, including interest rates forecasting while publishing our Weekly Economic Update (which we provide for free, by the way, just click that link to subscribe). Moreover, with the onset of the pandemic we turned our attention to COVID-related changes in the economy and began to regularly produce near-term recovery models for the economy.
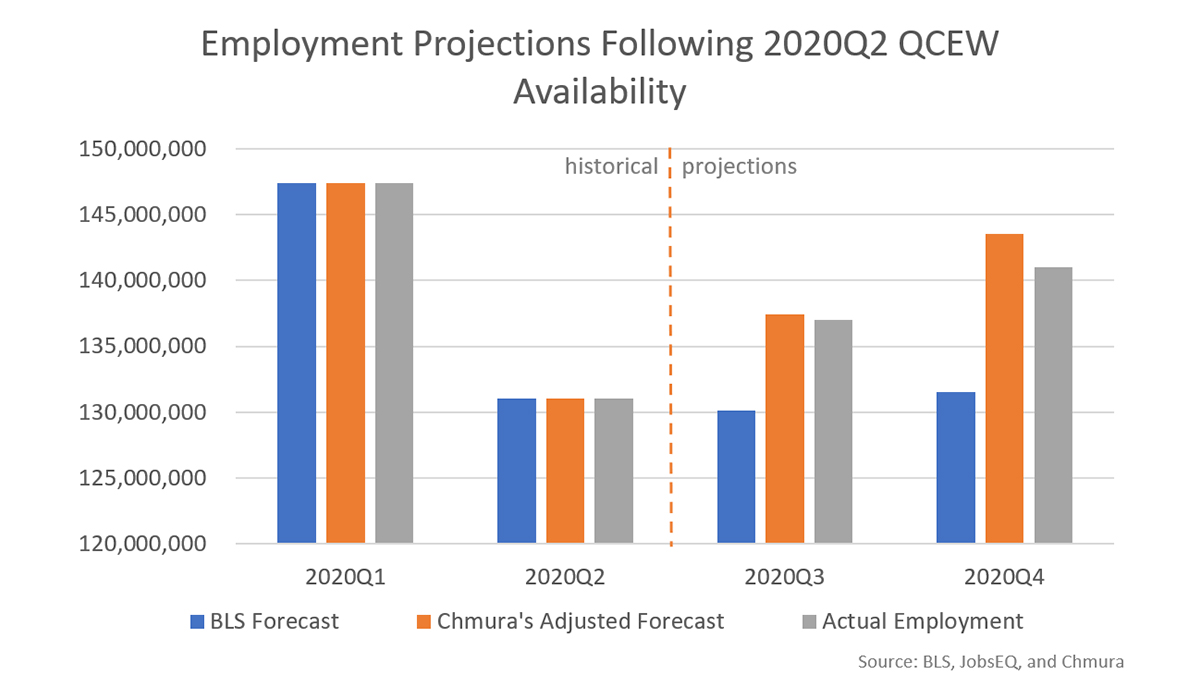
The below chart illustrates the benefits of our forecasting approach in the COVID environment. This chart contains covered employment and projections from our JobsEQ data set that was released in January 2021 and based on the 2020Q2 Quarterly Census of Employment and Wages (QCEW) data released in December 2020.[2]
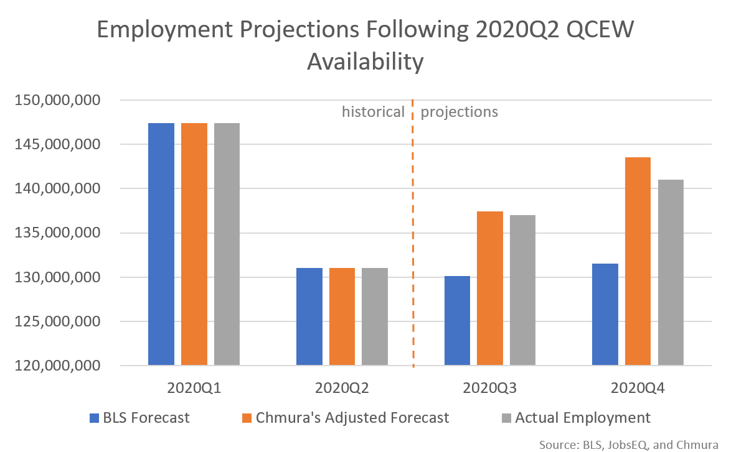
As can be seen in this chart, our adjusted forecast increased the accuracy of the projected employment estimates. In the third quarter, for example, using the standard, long-term BLS forecast would undershoot actual conditions by over six million jobs, or 5.0% too low.[3] In JobsEQ, our third quarter employment numbers were overall within 0.3% of the actual values. For the fourth quarter of 2020, the standard forecast would be even further off, over nine million jobs too low, or 6.7% off. In contrast, our COVID rebound forecast put estimated employment about three-and-a-half times closer to actual, being about 1.8% on the high side, with the recovery at that point proceeding slower than expected.
How we adjust our forecasts
To explain the above chart further, if we took the approach of using QCEW through the second quarter and projecting from there using the BLS ten-year forecast, the resulting implied employment is shown by the blue bars. The gray bars illustrate the actual QCEW jobs data that has since been published by the BLS. In between are the orange bars, showing the actual approach we had taken in JobsEQ.[4] The third quarter data represents our “preliminary estimates,” which we regularly produce for the quarter immediately following the latest QCEW (more about our preliminary estimates can be read here).[5] From there, we utilized a short-term alternative COVID forecast that our JobsEQ clients have the option to use.[6] This alternative forecast captured the expected faster-than-average job growth anticipated in the fourth quarter.
In addition, our COVID recovery forecast is made at detailed industry levels[7] to capture nuance in the recovery, where the variation in job rebounds has been considerable. For example, some industries lost a large percentage of jobs in the second quarter but gained most of those jobs back by the very next quarter—for example, offices of dentists and motor vehicle manufacturing. Other industries, however, gained back very little of their steep second quarter job losses by the third quarter—examples being amusement parks and traveler accommodations.
Given our commitment to accuracy, we have been bringing these alternative COVID forecasts into JobsEQ for our clients since August 2020. Bringing an extra set of projections into a system like JobsEQ is no trivial matter. For JobsEQ, we produce unique forecasts for every county in the nation, and not only for the more than 800 occupations and over 1,000 industries, but at the level of detail of occupations within industries—which means projections for over 100,000 occupation/industry combinations for each of the 3,000+ counties in the nation.
After a quarterly update of JobsEQ, which includes an update of all our industry and occupation employment data, running an alternative COVID forecast requires about an extra week of runtime. The point being, it isn’t something we take lightly. But it is part of our commitment and focus to helping our clients with accurate data.
Quality assurance
This extra effort in forecasting is typical of our orientation to quality and accuracy. At Chmura, we’ve long had the motto, “Best data. Best decisions.” It has been in our company’s DNA to assist the data-driven decision-making of our clients with nothing but the best supporting data.
Are we perfect? No, there is always room for improvement. But we still strive for a level of accuracy that well meets our clients’ needs, even though we produce hundreds of billions of data points and not a day goes by without our servers computing new data.
For further illustrations of our methods, see our previously written blogs addressing our data quality and modeling approaches for our impact multipliers, preliminary employment estimates, and regional occupation estimates.
Please don’t hesitate to reach out to us for more information or for a demonstration of our regional economic data products.
[1] These adjustments start with accounting for how a region’s mix of industries and occupations differs from that of the nation. We also adjust for the overall growth rate of the region, modeling each region based upon factors that include past performance and underlying local population growth expectations.
[2] After we import the full QCEW, our quarterly update can take over a month of additional processing time as we integrate other types of employment (e.g. self-employed), run occupation-related computations (including employment, unemployment, and commuting patterns), and update our other models so that they all are incorporating the very latest data. This is why these data were released within JobsEQ in January though the full BLS source data were published in December.
[3] The reader may notice that the third quarter employment is lower than the second quarter value. The long-term forecast on which this is based calls for long-term growth, but the third quarter value drops slightly due to seasonal patterns.
[4] Within JobsEQ, certain analytics illustrate employment with a four-quarter moving average; in these examples, the underlying quarterly data are being broken out.
[5] Since that preliminary employment blog was written, a change in the timing of our quarterly update schedule was made that changed the number of preliminary estimate quarters from two to one.
[6] The other option being the default baseline forecast that follows the BLS ten-year forecast. The value of having both options for our clients is having the option of using both an “optimistic” and “pessimistic” scenario when strategic planning.
[7] At the four-digit NAICS level.


