See how an economic impact model measures regional jobs, income, output, and multiplier effects, with practical insight into credible analysis.
Site Selection
Economic Impact
Data

By Chmura Economics & Analytics
Published Nov 6, 2017
Key Takeaways
- Regional multiplier estimates must reflect local suppliers, wages, industry structure, and the defined study boundary.
- Direct, indirect, and induced effects should remain separate so stakeholders can understand how each estimate was produced.
- Current data, detailed industry codes, consistency checks, and verified supplier records make economic impact findings easier to defend.
A credible economic impact model must reflect the region, industry, wages, and supplier relationships behind the project being studied. National averages alone cannot show how much economic activity will remain local or how many jobs a specific investment will support.
Chmura’s original model methodology addresses this issue through regional input-output accounting, current wage records, detailed industry estimates, and geographic consistency checks. The result is a more conservative framework designed to produce economic impact estimates that leaders can explain to boards, funders, businesses, and community stakeholders.
What an economic impact model measures for a region
An economic impact model estimates how a project, business, program, or industry affects economic activity within a defined region. It measures the initial activity and the additional jobs, labor income, and output supported as money moves through local suppliers and household purchases.
Consider a manufacturer planning a county expansion. The direct effect includes the facility’s production, payroll, and employment. Local purchases from maintenance firms, transportation providers, and other suppliers create indirect effects. Employee spending at local stores, restaurants, housing providers, and service businesses creates induced effects.
The geographic boundary matters because spending that leaves the study area will not support further local activity. A supplier purchase can count as a local effect in a statewide analysis and fall outside the boundary of a county study. The model must estimate how much activity remains inside the selected region before applying multiplier effects.
A useful analysis will clearly define five elements:
- The project or activity being measured
- The industry classification assigned to the activity
- The county, state, or custom region included
- The direct jobs, payroll, or output entered
- The time period covered by the estimate
Clear inputs give stakeholders a defensible basis for interpreting the results. Vague project definitions can produce totals that appear precise while resting on weak assumptions.
Input-output accounting converts initial activity into multiplier effects
Input-output accounting maps the purchasing relationships between industries. It shows which goods and services each industry uses and how additional activity in one sector supports activity among its suppliers. Economic impact models apply these relationships to estimate the ripple effects associated with a specific project.
The Chmura model begins with the national input-output matrix published by the U.S. Bureau of Economic Analysis. That matrix covers close to 400 industries in its five-year release and about 100 major industries in its annual release. The national relationships provide the base for estimating how industries purchase from one another.
A hospital expansion provides a practical illustration. Construction spending initially supports contractors and their workers. Contractors purchase materials, equipment, engineering services, and transportation. Once the hospital begins operating, it purchases medical supplies, utilities, administrative services, and facility support. The model traces those purchases through the regional economy.
Input-output accounting supplies the structure, while regional adjustment determines how much of each purchase will occur locally. Two counties can host the same project and produce different estimates because their supplier bases differ. A county with local construction suppliers, health service firms, and business support providers will retain more spending than a county that must obtain those inputs elsewhere.
Multiplier stages require separate interpretation in impact analysis
“Each stage answers a different question, so combining them into one total without explanation can hide the economic relationships behind the estimate.”
Direct effects represent the initial project activity. Indirect effects reflect purchases from suppliers. Induced effects reflect household spending supported by wages earned through the direct and indirect activity. Chmura’s original explanation defines indirect multipliers as supply chain effects and induced multipliers as effects tied to employees spending their wages as consumers.
A multiplier of 1.60 means each dollar of direct activity is associated with an estimated $1.60 in total regional output. The additional $0.60 comes from indirect and induced effects. It does not mean the original dollar is spent repeatedly without limits. Each round becomes smaller as purchases leave the region through imports, savings, taxes, and other leakages.
|
Impact component |
What the estimate communicates |
Practical interpretation |
|
Direct effect |
It measures the activity entered for the project or industry. |
A company adds jobs, payroll, production, or operating spending within the study area. |
|
Indirect effect |
It estimates activity supported through regional supplier purchases. |
Local contractors and service firms receive added business from the project. |
|
Induced effect |
It estimates activity supported through household purchases. |
Workers use part of their earnings at businesses within the region. |
|
Total effect |
It combines direct, indirect, and induced estimates. |
The figure represents the full modeled regional effect within the stated boundary. |
|
Multiplier |
It compares the total effect with the direct effect. |
A higher value indicates that more economic activity is estimated to remain within the region. |
Separating the stages helps leaders explain which results are tied directly to the project and which depend on modeled purchasing behavior.
Regional industry structure determines local multiplier strength
Regional multipliers depend on the size, capacity, and composition of the local economy. A larger multiplier is appropriate only when the region has enough suppliers, workers, and supporting industries to retain a greater share of project spending.
Chmura’s methodology considers regional industry mix, supply capacity, economic breadth, and trade flows when constructing state and county input-output matrices. These factors affect the share of industry purchases that local businesses can fulfill.
A food processing facility will need agricultural products, packaging, transportation, equipment repair, utilities, and business services. A region with firms that provide those inputs will capture more indirect activity. A region that imports most of those goods and services will show greater leakage and a smaller multiplier.
This distinction matters when comparing sites. Applying the same national multiplier to every location can overstate the expected result for smaller or specialized economies. A regional analysis should reflect actual supplier capacity rather than assume that every purchase can be completed locally.
Multiplier size also requires judgment. A larger figure does not automatically signal a better project. Leaders should examine the direct investment, job quality, wages, fiscal effects, land requirements, and local supplier fit alongside the multiplier.
Current wage data improves employment impact estimates
Employment multipliers depend on the relationship between industry output, worker productivity, and wages. Current wage records support more credible job estimates because the same amount of business revenue will support fewer workers when average compensation is higher.
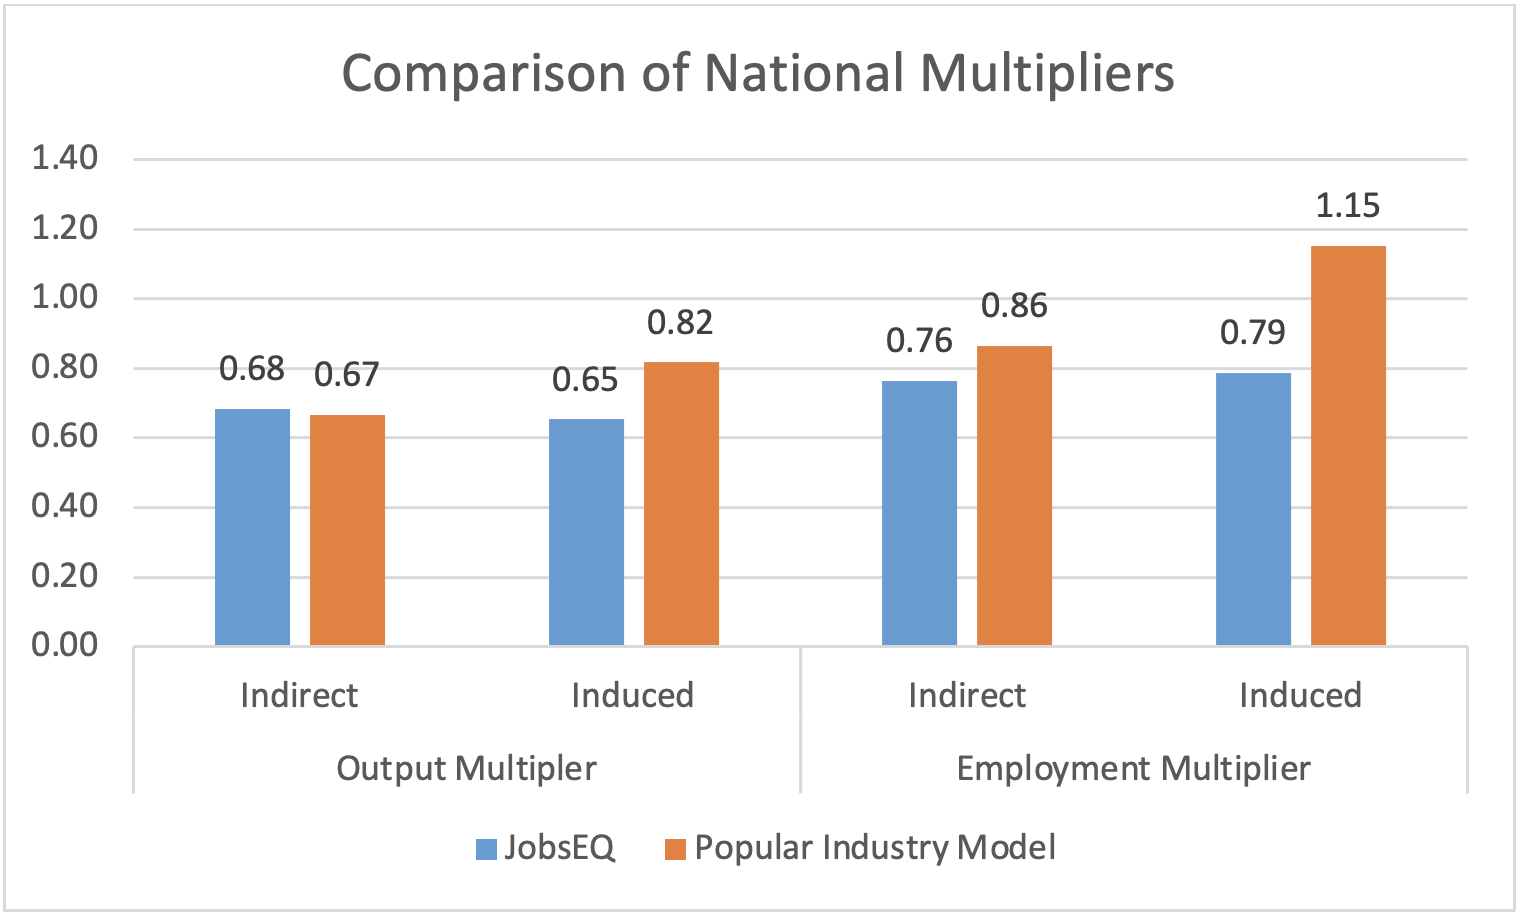
The original Chmura methodology used the latest available productivity and wage records, updated quarterly, to convert output multipliers into employment and labor income multipliers. Models relying on older annual wage figures can produce larger employment estimates when those records understate current pay.
Suppose two models begin with the same $10 million increase in industry revenue. One uses an average annual compensation figure of $50,000, while another uses a current figure of $62,500. A simplified calculation based only on compensation would associate the first estimate with 200 positions and the second with 160. Actual modeling includes productivity and other costs, but the example shows why wage timing matters.
Higher wages producing smaller job estimates does not signal weaker performance. It reflects the greater cost and productivity associated with each position. Conservative employment estimates give stakeholders a sounder basis for planning workforce programs, infrastructure, and public services.
Six-digit industry detail supports more precise impact analysis
Detailed industry classification improves economic impact estimates because businesses within a broad sector can have very different purchasing patterns, wage levels, and productivity. Six-digit North American Industry Classification System codes provide more precise inputs than broad industry groups.
The Bureau of Economic Analysis publishes national input-output detail for close to 400 industries every five years and roughly 100 major industries each year. Chmura’s methodology imputes input-output relationships at the six-digit level, covering more than 1,000 industries, using industry employment and wage records.
A general manufacturing category can include food processing, medical devices, automotive parts, and semiconductor production. Each activity purchases different materials and services. They also have different staffing patterns and compensation levels. Assigning all four projects to one broad multiplier will erase those distinctions.
Precise classification starts with understanding what the operation produces and how it earns revenue. Analysts should review the project description, expected staffing, production process, and known purchases before selecting a code. The code should represent the primary activity rather than a convenient broad category.
Industry detail will not fix weak project inputs, but it reduces avoidable mismatch between the proposed activity and the economic relationships used to model it.
Geographic consistency checks prevent inflated local estimates
Geographic consistency means a smaller region should not produce implausibly larger multipliers than the broader region containing it. County and state estimates can differ, but those differences must remain consistent with supplier capacity, regional production, and economic scale.
Some impact models can produce county multipliers that exceed state multipliers for the same industry. Chmura introduced geographic checks intended to keep comparisons logically consistent across nested areas. Its model also checks multipliers against supply chain relationships, regional gross domestic product, and productivity.
A rural county with limited suppliers should not appear to retain more industry spending than its entire state without a clear economic reason. An unusually high county multiplier could imply levels of local production or supplier activity that exceed the county’s recorded industry base.
These checks protect the analysis from outputs that are mathematically generated yet difficult to defend. They also help leaders compare a county proposal with a multiregion labor shed or statewide estimate without mixing incompatible assumptions.
JobsEQ supports this execution by connecting regional industry and occupation records with economic impact inputs. The shared data structure reduces inconsistencies that can appear when analysts copy figures between separate systems or use mismatched geographies.
Supplier data strengthens estimates when project details exist
“A precise regional multiplier cannot compensate for inaccurate direct inputs.”
Economic impact multipliers represent industry averages, so business-specific supplier information will strengthen an estimate when it is available. The most defensible analysis combines a regional model with verified project inputs rather than treating an average multiplier as a complete description of every business.
A manufacturer might report that 40% of its material purchases will come from suppliers inside the region. Another company in the same industry could source nearly every major input from outside the area. An industry-average multiplier cannot fully reflect both operating patterns.
Supplier surveys can clarify purchase categories, spending amounts, vendor locations, payroll, hiring plans, construction costs, and expected operating schedules. The original model description notes that Chmura’s economists conduct business surveys and use the responses to improve multiplier estimates.
Specific inputs also make the final report easier to explain. Stakeholders can see which effects come from confirmed project commitments and which rely on modeled industry relationships. That distinction supports more credible board presentations, funding reviews, and public discussions.
Disciplined economic impact analysis requires both sound modeling and careful project verification. A precise regional multiplier cannot compensate for inaccurate direct inputs. Strong results come from selecting the correct industry, defining the study area, using current wage records, testing geographic logic, and replacing averages with verified supplier information when possible.