Get practical insight into the labor force participation rate by age group and what it means for hiring, reports, and workforce planning.
Data
Forecasting
Trends
Analysis

 By Former Chmura Staff
Key Takeaways
-
Prime-age labor force participation provides a clearer read on core labor supply than the headline rate because it removes much of the noise from schooling and retirement.
-
Retirements explain why total labor force participation can remain below prior levels even when younger and prime age groups show stronger labor market attachment.
-
Age-specific participation data helps workforce, education, economic development, and corporate teams build more defensible reports, hiring plans, and funding cases.
Labor force participation data show a labor market that is stronger than the headline rate suggests for working-age adults, while older retirements continue to hold down the total rate. The labor force participation rate measures the share of people who are working or actively looking for work, so it gives employers, workforce boards, colleges, and regional leaders a clearer view of available labor than unemployment alone.
The national labor force participation rate was 61.8% in May 2026, while the unemployment rate held at 4.3%, according to the U.S. Bureau of Labor Statistics. That pairing matters because a low unemployment rate can make hiring look tight, but participation data explains which age groups are adding workers, which groups are staying out, and where labor supply plans need sharper detail.
Labor force participation measures workforce availability beyond unemployment
Labor force participation measures how many people are either working or looking for work. Unemployment measures only people already in the labor force who do not have a job. That difference is important because people outside the labor force are absent from the unemployment rate, even when their absence affects hiring.
A county can report low unemployment while employers still struggle to fill roles. A workforce board might see a 4% unemployment rate and assume the local labor pool is small, but participation data can show that some adults are outside the labor force because of retirement, school, caregiving, disability, or discouragement. Each reason points to a different response.
For workforce planning, the labor force participation rate is useful because it separates active workers from the broader population. A college evaluating a new training program needs to know if the region has people available to train. An employer comparing 2 locations needs to know if local labor supply exists beyond people who are currently unemployed.
“Labor force participation data show a labor market that is stronger than the headline rate suggests for working-age adults, while older retirements continue to hold down the total rate.”
The headline rate hides a split recovery by age
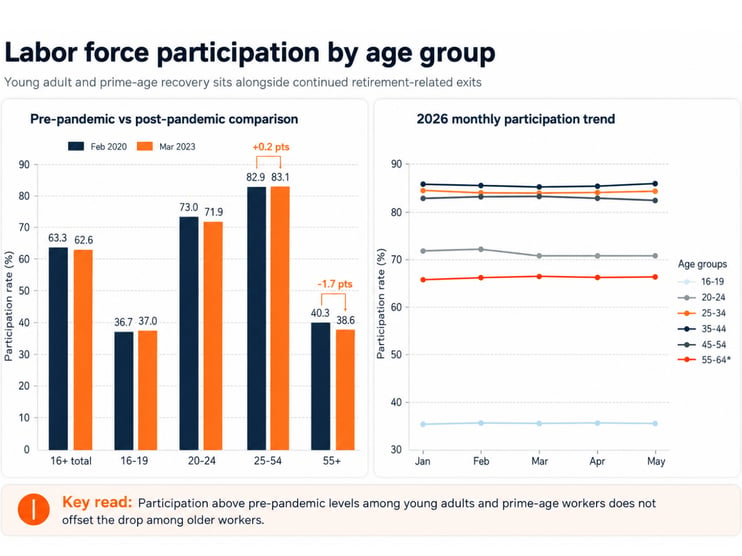
The total labor force participation rate can make recovery look weaker than it is for core working-age groups. Chmura’s analysis shows total participation for ages 16 and older was 62.6% in March 2023, still below the 63.3% level from February 2020. Age groups tell a more useful story.
|
Workforce signal |
What the data means for planning |
|
Total participation stayed below February 2020 levels in March 2023 |
The broad labor pool had not fully recovered because older workers remained less attached to work. |
|
Teen participation moved slightly above its pre-pandemic level |
Entry-level labor supply had shown signs of renewal among the youngest workers. |
|
Adults aged 20 to 24 remained below the prior level |
Early career hiring still required close tracking because recovery was uneven. |
|
Prime age participation moved above its pre-pandemic level |
The core working-age labor pool had regained strength. |
|
Participation among workers ages 55 and older fell the most |
Retirement patterns were still pulling down the overall rate. |
The split matters because headline measures can lead to blunt choices. A regional labor market brief that reports only the total rate will miss that prime-age workers have returned more fully than older workers. A hiring plan based only on the headline rate will also miss which age groups are actually available.
Young adult participation signals stronger early career labor supply
Young adult labor force participation helps show the strength of the entry-level and early career workforce. Chmura’s data shows participation among ages 16 to 19 rose from 36.7% in February 2020 to 37.0% in March 2023, placing that group above its pre-pandemic level.
The latest supplied data adds useful context. Participation among ages 16 to 19 moved from 35.4% in January 2026 to 35.7% in May 2026. That is a narrow movement, but it shows stability through the first 5 months of the year. Employers hiring for retail, food service, recreation, internships, or seasonal roles can use that pattern to plan outreach timing.
The 20 to 24 group tells a more cautious story. Participation was 73.0% in February 2020 and 71.9% in March 2023, and then measured 70.5% in May 2026 in the supplied data. Early career labor supply needs a separate read because school enrollment, wages, career expectations, and work schedules all affect this group differently from teenagers or prime-age adults.
Prime age participation shows the recovery has broadened
Prime-age participation covers adults ages 25 to 54, the group most closely tied to the core labor pool. Chmura’s analysis shows this group rose from 82.9% in February 2020 to 83.1% in March 2023, moving above its pre-pandemic level.
That finding matters because prime-age participation reduces noise from schooling at younger ages and retirement at older ages. A corporate workforce team evaluating a production expansion, for instance, will get a more useful read from adults ages 25 to 54 than from the total population rate. The total rate can look weak even when the core hiring pool has strengthened.
The 2026 data also shows solid participation inside the prime age range. Ages 25 to 34 reached 84.0% in May 2026, ages 35 to 44 reached 84.9%, and ages 45 to 54 stood at 82.8%. The practical lesson is clear: workforce availability must be read by age group before leaders make assumptions about hiring limits.
Retirements keep total participation below prior labor levels
Retirements remain the clearest reason total labor force participation can stay below prior levels even when younger and prime age groups improve. Chmura’s analysis shows participation among workers ages 55 and older fell from 40.3% in February 2020 to 38.6% in March 2023.
That 1.7 percentage-point decline is larger than the movements recorded for younger groups in the same comparison. It also has a different meaning. A drop among older workers is less likely to be reversed through short-term recruiting alone because many people have fully exited work. Some will return part-time, but many will leave permanently.
Employers and regional planners should separate retirements from short-term labor tightness. A hospital looking for experienced nurses, a manufacturer seeking supervisors, or a public agency replacing senior staff needs succession planning, training capacity, and compensation benchmarks. The 55 to 64 data supplied for 2026 was not seasonally adjusted, but it still showed participation edging from 66.4% in January to 66.9% in May, which deserves monitoring without overstating the trend.
Hiring plans need age-specific participation data
Hiring plans improve when participation data is grouped by age, occupation, and region. The U.S. economy added 172,000 jobs in May 2026, according to the Bureau of Labor Statistics, which means employers still needed workers even as total participation remained below older peaks.
Age-specific participation helps explain where hiring pressure will ease and where it will persist. A college recruiting students into health programs needs to understand prime-age worker availability differently from an employer filling summer jobs. A site selection team comparing 3 metros needs to know if each market has enough workers in the right age bands for the roles being planned.
Chmura’s JobsEQ can support this work when teams need to compare age patterns, occupations, wages, and custom regions in one workflow. The value is practical: a workforce snapshot can move from a broad participation question to a clearer hiring market comparison that leaders can defend in a board meeting, grant package, or executive review.
“The best reading of the current pattern is neither broad optimism nor broad concern.”
Regional workforce reports should separate participation from unemployment

Regional reports should treat participation and unemployment as different measures because they answer different questions. Unemployment shows unused labor among active job seekers. Participation shows how much of the working-age population is connected to the labor force in the first place.
A stakeholder-ready workforce report should include the following checks:
- Compare total participation with prime age participation.
- Separate older workers from core working-age adults.
- Review early career groups before entry-level hiring plans.
- Pair participation trends with wage and occupation data.
- Explain data limits when figures are not seasonally adjusted.
This structure helps non-technical audiences avoid false comfort from a low unemployment rate. A region can have low unemployment because many people are employed, but it can also have low unemployment because fewer people are actively looking for work. Those conditions require different actions.
The strongest reports translate the measure into a clear choice. Economic development teams can use participation data to explain labor availability to prospects. Education leaders can use it to support program viability analysis. Employers can use it to adjust recruiting, pay, scheduling, and location plans.
Better participation analysis supports stronger stakeholder workforce answers
Labor force participation data becomes useful when it helps leaders answer a specific workforce question with enough detail to act. The best reading of the current pattern is neither broad optimism nor broad concern. Younger workers and prime-age adults show stronger attachment to work, while retirements continue to reduce the total rate.
That judgment matters because workforce conversations often start with a single number. A board member asks why hiring is difficult. A funder asks if a program reflects local labor needs. An executive asks if a region can support expansion. Participation data gives a better answer when it is broken out by age, compared over time, and tied to the workforce plan on the table.
Chmura’s role fits this need when teams must turn labor market data into defensible reports, workforce plans, and stakeholder communication. The point is not to make participation data more complex. The point is to use the right level of detail so leaders can explain what is happening, what it means, and what action the data supports.