The U.S. economy seems to be facing a disconnection. Most of the recent metrics point to a stable and strong economy. In the first quarter of 2023, GPD grew at a stronger-than-expected 2.0% annualized rate.
Data
Forecasting
Economy
JobsEQ
Analysis
Consulting
Plus
Pro
Economic Trends
By Francesco Renna
Published Jul 3, 2023
Key Takeaways:
- The U.S. economy is facing a disconnection: most metrics point to a robust economy, yet many analysts expect a recession.
- Traditional Labor Market Indicators (LMI) are published with lags and are subject to revision. Moreover, they typically measure employment in a month or sometimes a quarter. Active job ads provide a timelier description of the dynamics in the labor market on a daily basis.
- We observe a strong deceleration in active job postings starting the middle of May that has not yet been captured by the traditional labor market indicators.
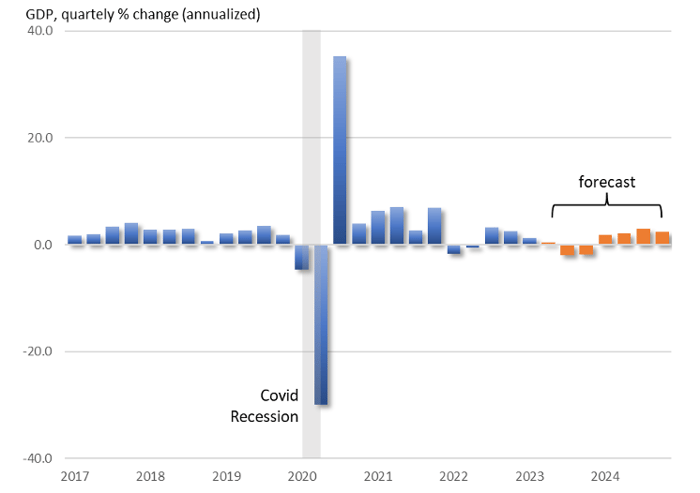
- Chmura's macroeconomic model predicts a negative growth rate of U.S GDP in the third and fourth quarters of 2023.
The U.S. economy seems to be facing a disconnection. Most of the recent metrics point to a stable and strong economy. In the first quarter of 2023, GPD grew at a stronger-than-expected 2.0% annualized rate. Employers have added more than 1.5 million jobs since the beginning of the year. Consumers’ spending is holding up notwithstanding inflation and higher borrowing costs. The banking system proved to be resilient to the failure of three regional banks. Yet at the same time, in a recent survey conducted by the National Association of Business Economists, three-fifths of the respondents say the economy will probably fall into a recession over the next 12 months.[1]
The strongest signal that a recession is looming over the U.S. economy comes from the financial market. Typically, yields on long-term investments are higher than short-term investments because investors need to be compensated for locking their assets over a longer time. When the opposite is true, as it is happening right now, economists refer to it as an inverse yield curve. The inverse yield curve reflects investor expectations of the Fed lowering federal funds rates in the future. Typically, the Fed lowers the federal funds rate during a recession to boost the economy. That is why an inverse yield curve is considered a leading indicator for recession. And in fact, since the 60s every case of an inverse yield curve has preceded a recession.
But there is another sign of an imminent slowdown of economic activities: Real-Time Job Ads.
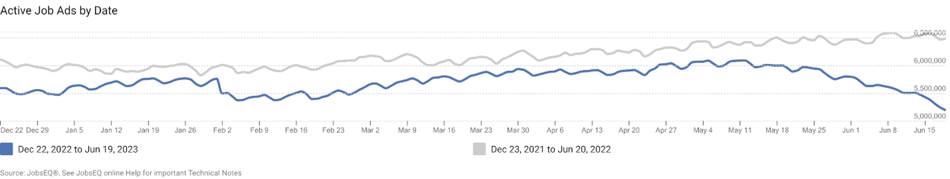
Traditional labor market indicators are useful tools to analyze current market conditions, but they are published with lags and are subject to revision. Moreover, they typically measure employment in a given month or quarter. Active job ads are collected daily and published in real-time, providing a timely description of the dynamics in the labor market. Looking at the volume of active job ads for this year we notice two things:
- The volume is lower than for the same period last year.
- There has been an acceleration in the downward trend since the middle of May.
Fig 1. Active Job Posting for the U.S.
The U.S. unemployment rate for May stood at 3.7%. Although this is still quite low by historical levels, it represents a 0.3 percentage point increase since April, the largest month-over-month increase since the Covid recession. There are good reasons to suspect that the metric is underrepresenting the true slowdown in economic activities for the month of May. The unemployment rate represents the number of individuals who were without a job and actively looking for one in the week covering May 12. But the slowdown in active job ads accelerated in the second half of the month and continued into June. Therefore, we expect an even larger increase in the unemployment rate for the month of June, which will be released on July 7th.
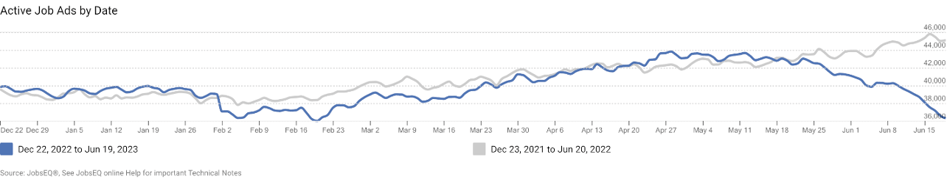
A dive into the details of the real-time job ads reveals some interesting insight into the dynamics of this slowdown. It appears as if the slowdown was concentrated in specific locations and it is now spreading to other locations. The shift in the volume of active job ads this year compared to the year before is driven by regions that are hubs for technology-related jobs such as San Francisco, Austin, Phoenix, and Denver. Other cities seemed to be immune from this slowdown until the middle of May. This reveals some important features of what a recession in the second half of 2023 may look like.
Fig 2. Active Job Posting by Date
San Francisco – Oakland – Berkely, CA MSA
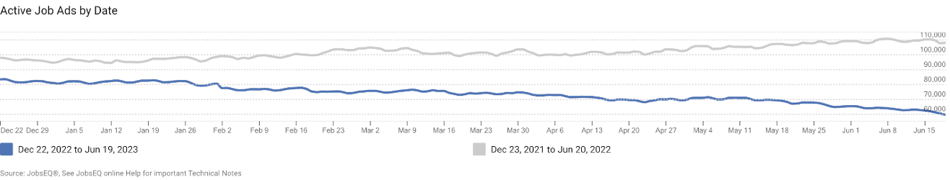
Richmond, VA MSA
Each recession is unique in that it hits specific sectors harder than others. For example, the Great Recession hit disproportionately construction and banking. The largest share of job losses during the Covid Recession were in Leisure and Hospitality and Retail. We expect the next recession to hit the sectors harder that ramped up employment during the pandemic. And we already see signs of this.
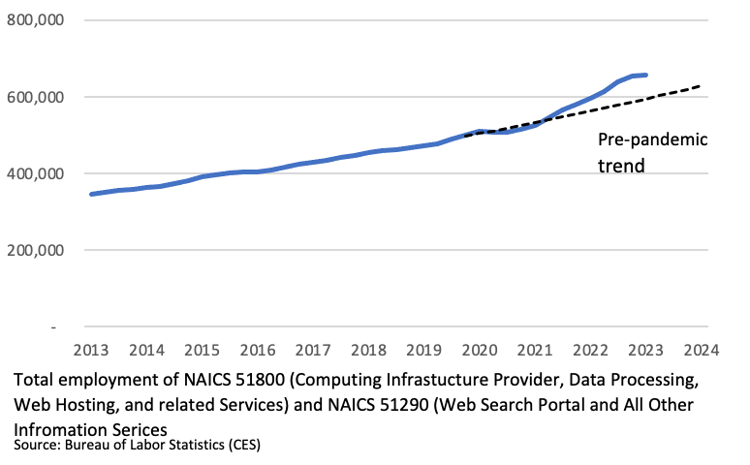
Restrictions on social gatherings imposed during the pandemic forced many individuals to conduct most of the activities at home that previously took place outside the house. These activities lead to an increase in the demand for technology which allowed the transformation of homes into workplaces, gyms, and places of entertainment. Firms like Peloton, Zoom, Meta, and Alphabet saw a surge in the demand for their products and started hiring at unprecedented levels. When restrictions were lifted companies found they had over-hired and are now cutting back on employment. Most of the news about mass layoffs relates to IT workers.[2]
Figure 3: Employment in selected IT industries surged during the Pandemic
Similarly, low mortgage rates, a boost in savings from reduced consumption, generous government pandemic-related assistance, and the need for space due to the new activities that need to be conducted at home, brought a herd of home buyers into the housing market. To meet this increased demand for housing, banks and mortgage institutions hired an army of loan officers. With the housing market stalling, most of these positions are no longer needed.
Figure 4: Comparison of Employment of Loan Brokers and Health Care
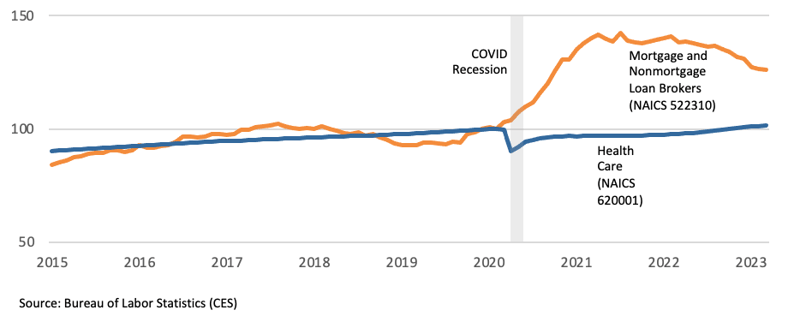
Feb 2020 employment = 100
While these two sectors may be the ones that will suffer the most from the contraction of the economy, we expect the negative impact of sustained inflation and high-interest rates to impact all sectors of the economy. At Chmura, we expect the U.S. economy to decline in the last quarters of 2023 before returning to growth in 2024.[3] While two consecutive quarters of negative GDP growth are called a technical recession, the ultimate arbiter of whether the economy is in a recession is the National Bureau of Economic Research (NBER).[4]
--------------------------------------------
[1] AP NEWS, Survey of economists: Inflation will stay high this year, and so will Fed’s key interest rate, May 22, 2023
[2] The Crunchbase Tech Layoffs Tracker
[3] To subscribe to our Quarterly Economic Review, please visit https://www.chmura.com/quarterly-economic-update
[4] In addition to quarterly GDP, the committee considers other monthly indicators such as employment, real consumer spending, and industrial production to define when a recession starts and ends.


