Those paying attention to poverty rates may feel dismayed when, despite economic improvements in their region, rates remain stagnant. Why is this the case?
Data
Economy
Trends
Analysis
By Mike Chmura
Published Jul 28, 2022
Fifty years ago, in 1972, the official U.S. poverty rate was 10.2%. Now, in 2022, it remains at 10.2% (see Figure 1).[1] Can this be true? Have we made no progress in bringing down poverty? Over the past 50 years, U.S. standards of living have risen, and real gross domestic product (GDP) has nearly quadrupled.[2] Those paying attention to poverty rates may feel dismayed when, despite economic improvements in their region, poverty rates remain stagnant. Why is this the case—shouldn’t there at least be some modest improvement?
Figure 1: Poverty Rate Virtually Unchanged Over 50 Year Period
Source: U.S. Census Bureau, Chmura
There have been many arguments presented that try to explain why poverty has failed to decrease. Some point to income inequality as a reason for this contrast, explaining that GDP gains benefit the wealthiest Americans while those in poverty don’t see the same gains.[3] Others suggest government anti-poverty programs are ineffective.[4] Increased immigration has also been introduced as an explanation as undocumented immigrants tend to have higher poverty rates than native citizens.[5]
None of these reasons, however, can accurately and fully account for the “reason” poverty rates have remained relatively stagnant. Specifically, data reveal “no necessary positive correlation between income inequality and poverty.”[6] Other research concludes that U.S. anti-poverty programs have had “major impacts” on poverty and that immigration is “neither the sole, nor even the most important factor [influencing] the relatively flat poverty rate” as immigrants’ income tends to rise fast enough to offset the effects of additional immigration on poverty rates.[7], [8] In truth, the issue likely has much more to do with how the Census Bureau measures poverty than with any secondary influence. What the Census Bureau defines as “poverty” might not be what you expect, and there are many factors that are excluded by this key metric that, if included, show a different picture.
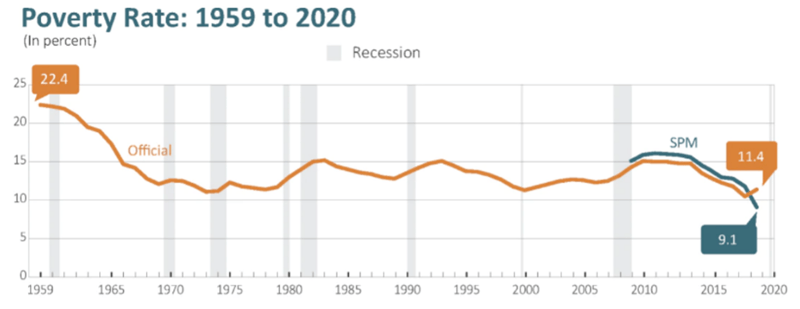
The Census Bureau began measuring poverty in 1959, and it is now officially defined as three times the cost of a “minimum food diet” in 1963 adjusted to current prices and based on family size. As this was understood even at the time it was introduced to be a fairly crude measurement for poverty, the Census Bureau also started providing a “supplemental poverty measure” (SPM) which adjusts for cost of living in different regions. The SPM uses a benchmark based off a more comprehensive cluster of everyday goods and services and accounts for post-tax income such as housing subsidies, tax credits, and food stamps.[9] While this measure is more comprehensive, experts note that such modifications only change the “level” and not the “trend” of poverty. This means the official measure of poverty should be just as good as the SPM when analyzing poverty changes over time.[10] Although the SPM has only been in use for about 10 years, this assumption seems to hold true in the data as the SPM has mostly trended with the official measure (See Figure 2).[11]
Figure 2: The Official Poverty Rate and SPM have Typically Trended Together
Source: U.S. Census Bureau
Both measures have attracted criticism. Some experts believe the measure fails to accurately represent the correct level of, and trends in, the poverty rate. According to some economists, it would be more accurate to report poverty levels as a measure of consumption rather than of income. Proponents of such a measure argue that relying on income as a measure of poverty produces an unclear “relative” poverty level that fails to accurately represent one’s quality of life, instead denoting only their income level as it relates to the rest of the economy. For example, in the 1970s, the internet was in its infancy, only concerning a few researchers. Yet, today, the World Bank estimates over 90% of Americans use the internet.[12] Such quality-of-life improvements are not considered by the official income poverty measurement. Measuring consumption is better for capturing quality of life changes over time according to its proponents as it is primarily concerned with assessing what people purchase (consume) rather than how a good is acquired.
There is no single method widely available that measures poverty in relation to a family’s consumption. Several academic papers and op-eds, however, have examined the issue at length in historical context. Steven Pinker, psychologist and author, claims in an op-ed for the Wall Street Journal that poverty fell from 11% in 1988 to 3% in 2018 when considering consumption.[13] A paper by economists Bruce Meyer and James Sullivan shows that a consumption-based poverty measure led to a much clearer decline in poverty rates— from above 30% in the early 1960s to about 5% in 2010 (see Figure 3).[14] The authors argue that consumption-based poverty measures, on top of accounting more precisely for quality of life, implicitly include important factors such as access to credit, accumulation of assets, and aid from anti-poverty programs which are excluded from the official income-based measurement. Furthermore, Meyer and Sullivan use a lower inflation rate in their analysis. Most economists agree that the CPI inflation rate (the inflation rate the official poverty measure is pegged to) overestimates actual inflation by more than one percentage point.[15] An upward bias in the official poverty threshold occurs as a result. Basing the poverty rate on a more accurate measure of inflation results in even greater decreases in poverty rates, according to the authors.
Data from the U.S. Department of Health and Human Services support the assertion that conditions are better for those in poverty than they were 50 years ago. For instance, Medicaid/CHIP covered 36.7 million more recipients in 2012 than in 1972 and 3.3 million more households received housing assistance over the same period.[16] Even in poverty, many can receive more support for food, healthcare, and housing than they would have 50 years ago.
Figure 3: The Consumption Poverty Rate Shows a Clear Decline
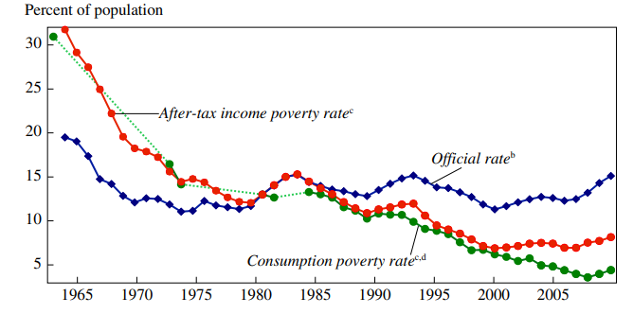
Source: Meyer & Sullivan
While the debate still surrounds which poverty measure is best, it is important to note what official poverty rates include and what is ignored. Critics of the consumption-based rate believe it inaccurately represents access to goods as individuals’ consumption habits vary, and others believe that even the official poverty rate understates the true poverty level.[17], [18] Its proponents, however, insist that a consumption-based poverty measure better demonstrates a decline in poverty rates over time as government “safety nets” have expanded and as GDP per capita has increased. Overall, given the breadth of the data and research relating to this topic, it would be reasonable to conclude that there has been significant progress in fighting poverty, despite the lack of movement in the official poverty level. Still, there is still much work to do as millions of Americans remain impoverished even in the most favorable estimates
-----------
[1] “Measuring America: How the U.S. Census Bureau Measures Poverty,” US Census Bureau (June 2021), https://www.census.gov/library/visualizations/2021/demo/poverty_measure-how.html
[2] “Real Gross Domestic Product,” Federal Reserve Bank of St. Louis, 29 June 2022, https://fred.stlouisfed.org/series/GDPC1/
[3] Krugman, Paul. “On Fighting the Last War (On Poverty)” The New York Times (Jan 2014), https://archive.nytimes.com/krugman.blogs.nytimes.com/2014/01/08/on-fighting-the-last-war-on-poverty/?_r=0
[4] Tanner, Michael, “The American Welfare State: How We Spend Nearly $1 Trillion a Year Fighting Poverty — and Fail,” Policy Analysis No. 694, Cato Institute (April 2012), https://ssrn.com/abstract=2226525
[5] Rector, Robert, “Importing Poverty: Immigration and Poverty in the United States: A Book of Charts”, The Heritage Foundation (Oct 2006), https://www.heritage.org/immigration/report/importing-poverty-immigration-and-poverty-the-united-states-book-charts
[6] Rector, Robert, “Importing Poverty: Immigration and Poverty in the United States: A Book of Charts”, The Heritage Foundation (Oct 2006), https://www.heritage.org/immigration/report/importing-poverty-immigration-and-poverty-the-united-states-book-charts
[7] Yonatan Ben-Shalom, Robert A. Moffitt & John Karl Scholz, “An Assessment of the Effectiveness of Anti-Poverty Programs in the United States,” NBER (May 2011), https://www.nber.org/papers/w17042
[8] Jeff Chapman and Jared Bernstein, “Immigration and poverty: how are they linked,” BLS (Apr 2003), https://www.bls.gov/opub/mlr/2003/04/art2full.pdf
[9] Jeff Chapman and Jared Bernstein, “Immigration and poverty: how are they linked,” BLS (Apr 2003), https://www.bls.gov/opub/mlr/2003/04/art2full.pdf
[10] Jeff Chapman and Jared Bernstein, “Immigration and poverty: how are they linked,” BLS (Apr 2003), https://www.bls.gov/opub/mlr/2003/04/art2full.pdf
[11] Jeff Chapman and Jared Bernstein, “Immigration and poverty: how are they linked,” BLS (Apr 2003), https://www.bls.gov/opub/mlr/2003/04/art2full.pdf
[12] “Individuals using the Internet (% of population) - United States,” World Bank, https://data.worldbank.org/indicator/IT.NET.US-ER.ZS?name_desc=true&locations=US
[13] Pinker, Steven, “The Enlightenment is Working,” The Wall Street Journal (2018), https://www.wsj.com/articles/the-enlightenment-is-working-1518191343
[14] Bruce D. Meyer and James X. Sullivan, “Winning the War: Poverty from the Great Society to the Great Recession,” Brookings Papers on Economic Activity (2012), https://www.brookings.edu/wp-content/uploads/2012/09/2012b_meyer.pdf
[15] Kai Ryssdal and Sean McHenry, “When it comes to inflation measures, the Federal Reserve prefers the PCE,” Marketplace, https://www.marketplace.org/2022/04/29/when-it-comes-to-inflation-measures-the-fed-prefers-pce/
[16] Ajay Chaudry et al.,“Poverty in the United States: 50-Year Trends and Safety Net Impacts,” Office of the Assistant Secretary for Planning and Evaluation (Mar 2016), https://aspe.hhs.gov/sites/default/files/private/pdf/154286/50YearTrends.pdf
[17] Tara O'Neill Hayes, “Measuring Poverty in the United States: Comparing Measurement Methods,” American Action Forum (2021), https://www.americanactionforum.org/research/measuring-poverty-in-the-united-states-comparing-measurement-methods/#:~:text=A%20consumption-based%20poverty%20measure%20assesses%20what%20people%20-consume,that%20might%20be%20provided%2C%20as%20well%20as%20expenses
[18] Fremstad, Shawn, “The official U.S. poverty rate is based on a hopelessly out-of-date metric,” The Washington Post (Sep 2019), https://www.washingtonpost.com/outlook/2019/09/16/official-us-poverty-rate-is-based-hopelessly-out-of-date-metric/


