Tracking a company’s hiring trend is a valuable investment strategy. These trends can be watched with Chmura’s Real-Time Intelligence (RTI) analytic which houses job ads data on individual companies, gleaned from over 40,000 websites and updated daily.
Data
Economy
JobsEQ
Trends
Staffing
By Chmura Economics & Analytics
Published Mar 17, 2021
Tracking a company’s hiring trend is a valuable investment strategy. These trends can be watched with Chmura’s Real-Time Intelligence (RTI) analytic which houses job ads data on individual companies, gleaned from over 40,000 websites and updated daily. This RTI data set, at the company level, is directly and positively correlated with stock market growth. In this article, these linkages are described on two time frames as a leading indicator: year-to-year and month-to-month.
Correlations
In academic research, job ads have previously been linked with investment growth. In a 2019 study,[1] Gutierrez et al found a positive association between job postings and growth in sales and earnings. Moreover, they found a significant positive linkage between changes in the number of job postings and stock returns over the two trading days around the change.
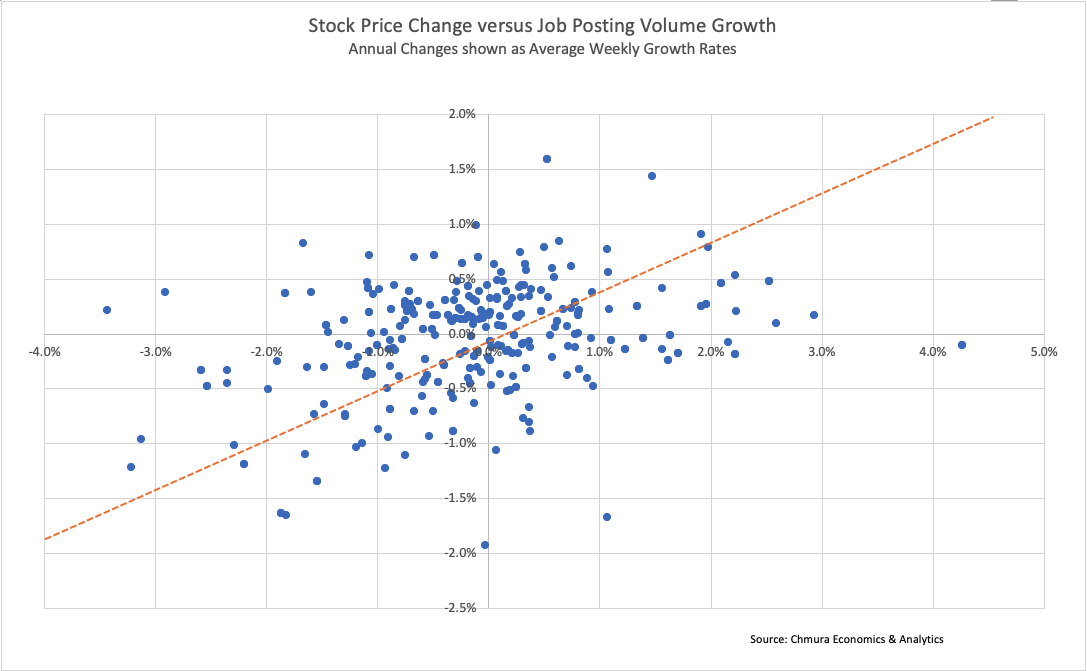
In this study, we used RTI data to examine correlations across two time frames. The first case was year-to-year changes in job ads which we found to be positively linked (r = 0.322)[2] with changes in closing stock market prices.

The above chart illustrates the concurrent relationship between an increase in new job ads and stock closing price growth. These changes were measured over the period 2018 through 2020, capturing year-to-year changes from 2018 to 2019 and the changes from 2019 to 2020.[3] A sample of 169 large- and mid-cap New York Stock Exchange firms, randomly selected as described below, was used for this analysis.
In the second case, for a predictive example and over a shorter timeframe, we compared the change in job ads in a month compared to the growth in stock prices over the subsequent month. For example, the change in new job ad volume growth for a company from January to February would be used to predict the change in its stock closing price from February to March. In this case, monthly job ads again had a positive and significant correlation (r=0.051) with subsequent months’ stock prices among the large- and mid-cap sized firms in our sample. This correlation was found in a sample of 5,746 cases, defined by 169 companies over 34 two-month pairs from 2018 through 2020.
The reverse predictive relationship also exists, at least on a month-to-month basis. A rise in stock prices in one month is associated with a positive increase in job ads in the subsequent month. The correlation for this relationship (r=0.053) in our sample of large- and mid-cap firms was a bit stronger than the reverse relationship. This positive relationship even held at two months out for stock prices being predictive of hiring growth (r=0.076).[4]
While related, there is not a simple, direct path between job ads and stock performance. Stock prices are partially a function of corporate income. Increasing income can be linked to growth, which in turn can be tied to an expanding workforce. An expanding workforce is derived from hiring—when the hiring is performed for growth as opposed to replacements. Hiring, finally, can be linked with job ads—though the relationship is not always one-to-one. But regardless of the many-stepped relationship and the possibility of other internal and external factors influencing stock prices, the demonstrated link remains. Our sample indicates a concurrent relationship between stock prices and RTI job ads data for large- and mid-cap firms as well as a short-term predictive relationship of each other at one-month lead time. Further research will be needed to explore other time frames. More research is also needed on other possible influencing factors as well as the linkage among small firms as is discussed below.
Methodology Notes
The sample for this study was selected through a random, stratified sampling of U.S. firms listed on the New York Stock Exchange. These firms were bucketed by sector and cap-size. We limited sampling to large-, mid-, and small-cap firms, aiming for a sample of ten firms in each cap-sector bucket. Within each bucket, firms were first randomly selected. We then selected only firms with at least 200 job ads[5] in the RTI data set over the preceding twelve months. Only sector-cap buckets containing ten qualifying firms were included for the sample. Historical stock price data for these firms were obtained as well as historical job ads data. From this group, some firms were removed due to not having a full three years of stock history or having gone through a merger within that time frame. Additional firms were removed due to small historical job ad volume with the minimum threshold for remaining in the sample being at least 100 new job ads in each of the three years (2018, 2019, 2020) of the study. This resulted in a final sample of 206 firms, distributed as shown below.
|
Final Sample Size and Distribution |
||||
|
Sector |
Large-Cap | Mid-Cap | Small-Cap | Total |
| Basic Materials | 9 | 9 | ||
| Communication Services | 8 | 8 | ||
| Consumer Cyclical | 8 | 9 | 8 | 25 |
| Consumer Defensive | 10 | 10 | 20 | |
| Energy | 10 | 8 | 18 | |
| Financial | 10 | 8 | 18 | |
| Healthcare | 10 | 9 | 8 | 27 |
| Industrials | 10 | 10 | 6 | 26 |
| Real Estate | 10 | 8 | 18 | |
| Technology | 4 | 9 | 7 | 20 |
| Utilities | 10 | 7 | 17 | |
| Grand Total | 91 | 78 | 37 | 206 |
Due to the sampling method for this project, the final sample included only a relatively small number of small-cap firms. These 37 small-cap firms were examined for the annual linkage, but the results for this sub-group were not statistically significant and so were not included in the above reported results.[6] The lack of significant correlation for this sub-group may have been due in part to the small size of the group as well as the more volatile job ad data for this group, since these firms tended to have fewer job ads and hence more volatility in their rates of change. In addition, the correlation for the small-cap firms from one month to the next (that is, for job ads being predictive of stock prices) did not pass the statistical significance test. Regardless, future research is planned for smaller companies, including those in this small-cap group, with a sampling method that will target a larger sample size for these firms as well as more variables so that this group can be examined in more depth.
For the annual correlation analysis, we computed the annual average daily closing stock price for each year and compared those on a year-over-year basis. For the annual job ads, we tallied the number of new job ads posted in a given year and computed the percentage change for those on a year-over-year basis as well. The annual percentage changes for both variables were converted to average, compounding, weekly rates of change to prepare for the linear correlation test.
For the monthly data analysis, we computed the monthly average daily closing stock prices for each month which were used to compute the month-to-month growth rates. For the monthly job ads, we tallied the number of new job ads posted in a given month and computed the percentage change for those from one month to the next. To prepare for the correlation test, both the stock and job ad monthly changes were mapped to integers on a scale from -3 to +3 representing seven quantiles according to their percent change (following the approach of Gutierrez et al). The ranges for these distributions are shown in the below tables.
| Month to Month Change in Job Ads | |
| Percent Change* | Assigned Value |
| 58% or more | +3 |
| 22% to 58% | +2 |
| 4% to 22% | +1 |
| -8% to 4% | 0 |
| -21% to -8% | -1 |
| -39% to -21% | -2 |
| below -39% | -3 |
| *In addition, a volume change of at least 2 ads is needed, otherwise a value of zero is assigned. | |
| Month to Month Change in Average Stock Closing Prices | |
| Percent Change | Assigned Value |
| 8.7% or more | +3 |
| 4.6% to 8.7% | +2 |
| 2.1% to 4.6% | +1 |
| -0.2% to 2.1% | 0 |
| -2.9% to -0.2% | -1 |
| -7.5% to -2.9% | -2 |
| below -7.5% | -3 |
About RTI Data
All job postings data used above are derived from JobsEQ, the Real-Time Intelligence (RTI) online job ad data set, pulled from over 40,000 websites and updated daily. Each month of ads is defined as new online ads that first appeared in that month. All ad counts represent deduplicated figures. RTI data are available to the public via a SAAS subscription license or by API access; contact Chmura for more details.
[1] “Are Online Job Postings Informative to Investors?” Elizabeth F. Gutierrez, Ben Lourie, Alexander Nekrasov, Terry J. Shevlin. July 2019. https://papers.ssrn.com/sol3/papers.cfm?abstract_id=3342669
[2] This change is statistically significant.
[3] In other words, we compared the year-over-year changes in job ads in 2018-2019 with the year-over-year changes in stock prices in the same 2018-2019 period. In addition, we compared the 2019-2020 change in job ads to the 2019-2020 change in stock prices.
[4] The reverse, however, does not hold a positive relationship. In our sample, job ads had a negative correlation with stock prices two months in advance.
[5] The matching of job ads to company was done via an analysis of the text strings used by each company in websites where that company’s ads were found. Company names often appear in different configurations in online ads. For example, the Sherwin-Williams Company can appear in ads as “Sherwin-Williams Company,” “Sherwin-Williams,” and “Sherwin Williams,” as well as in other variations. Thus, for most companies, such a combination of text strings were researched and used to capture the volume of ads related to an individual company.
[6] Despite the lack of correlation for this sub-group, keeping these firms in the sample would not affect the overall result; in other words, with small-cap firms still in the sample, the result would still be a statistically significant positive correlation between concurrent annual stock price growth and job ad growth. Likewise for the month-to-month results with small-cap firms still in the sample, the positive statistical correlations remain.


