Chmura’s RTI Recovery Model and related data, available free to the public on our website, is designed to specifically measure the state of the economic recovery at the state level. But why does the recovery model show such a large gap between current job ad volume and expected volume while JobsEQ RTI raw job ads data shows current volume is much closer to the volume from the prior year?
Covid-19
Trends
By James Stinchcomb
Published Feb 26, 2021
Chmura’s RTI Recovery Model and related data, available free to the public on our website, is designed to specifically measure the state of the economic recovery at the state level. The RTI Recovery Model compares indexed new job ad volume to a modeled “expected volume” level in order measure the state of the recovery for each state.
Another way to measure the recovery is to compare the change in year-over-year new job ad volume for a set of parameters. When current job ad volume moves closer to and surpasses previous year volume, the further along in the recovery that scenario is likely to be. JobsEQ users wanting to measure the economic recovery are able to use Chmura’s RTI data set as one of their tools for this method.
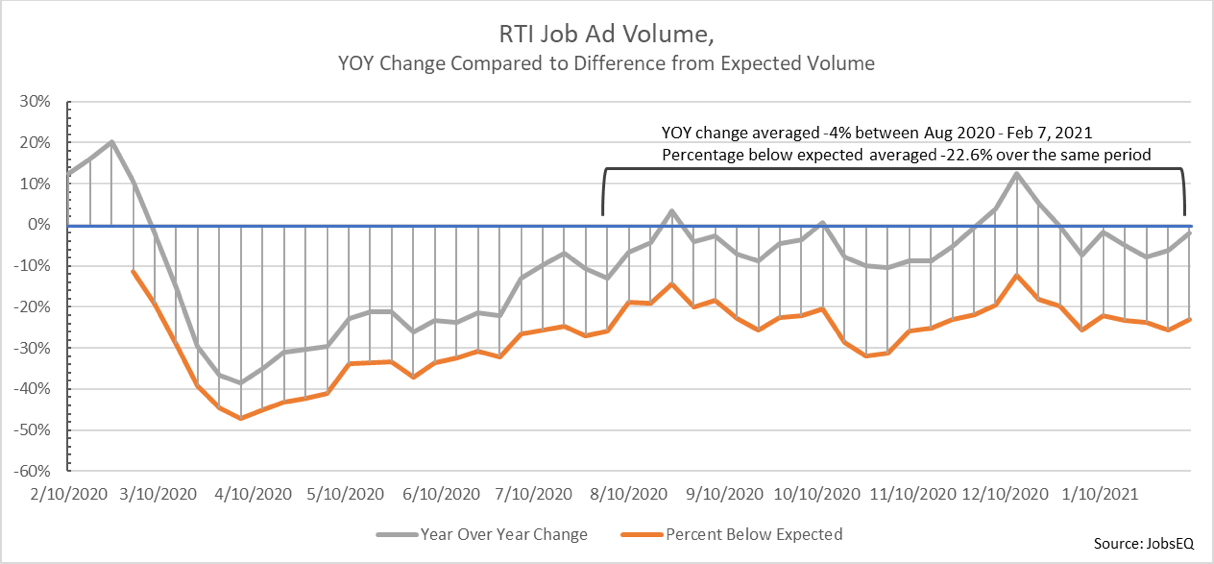
When comparing these two measures of the recovery, a common question is: “why does the recovery model show such a large gap between current job ad volume and expected volume while JobsEQ RTI raw job ads data shows current volume is much closer to the volume from the prior year?” This is a very good question, and one worth analyzing a bit further. The chart below plots the two measures of the U.S. recovery as a percentage difference from the baseline comparison data. From the beginning of August 2020 through the first week of February 2021, RTI job ad volume averaged 4% below volume from a year prior, but 22.6% below expected volume per the recovery model.

So why the large difference?
The main difference between the two comparisons is that the expected volume model is accounting for expected growth in volume had the pandemic not occurred. Because volume is expected to grow year-over-year, the expected volume comparison will show a larger gap than when comparing to straight volume from one year ago. For example, during the four weeks of February 2, 2020 through February 29, 2020, immediately prior to the pandemic impacting job postings, average national weekly RTI volume was 15% higher than one year prior. This growth is reflected in the expected volume model but is not reflected in the year-over-year comparison after the pandemic impacted job ad volume.
So which comparison should be used? Both! Each comparison provides value for measuring the recovery and trying to understand the current state of the economy. Comparing to volume from one year prior is a way of measuring how far away we are from getting back to the way things were, getting back to the “old normal.” On the other hand, comparing volume to the expected volume can help measure potential; for example, a region that was growing rapidly before the pandemic is likely to have a higher potential for growth during the recovery, meaning the region may reach previous levels of volume sooner than another region, despite potentially still being below expected volume.
Having said all of this, with the country approaching the 1-year anniversary of the onset of the pandemic and its impact on the economy, the value and interpretation of each measure is changing and will need to be reconsidered. The expected volume model, using pre-pandemic growth as a primary variable, will hold less informative value the farther away we move from the initial comparison point. At the same time, comparing volume to one year prior will lose a lot of value once we are comparing to pandemic levels, especially when comparing to early on in the pandemic's impact. Comparing to late March through April 2020, for example, is likely to be very troublesome and not hold a lot of comparative value as we will be comparing to the point when the pandemic was having its largest impact and many initial shutdown orders were going into effect. During this time, current volume will almost certainly exceed prior volume, and likely significantly, however that will not tell us much about the current recovery since the driving factor of the volume difference will be what had happened a year ago.
To account for these issues, we will be working on an update to the expected volume model to blend the two comparisons, accounting for growth but also adjusting for the shift caused by the pandemic. In other words, the model will attempt to measure expected volume under the "new normal."


