We've updated our RTI State Recovery Model! This model compares weekly online job ad volume in the COVID environment against expectations if the pandemic had not occurred.
Covid-19
Trends
By James Stinchcomb
Published Feb 9, 2021
Chmura’s RTI State Recovery model data has been updated and reflects revisions in historical source data.[1] This model compares weekly online job ad volume in the COVID environment against expectations if the pandemic had not occurred.
View Job Volume for Your State
To view the latest data for weekly volume in your own state as well as a map of the whole nation, check out the interactive graphics here.
State Recovery Model
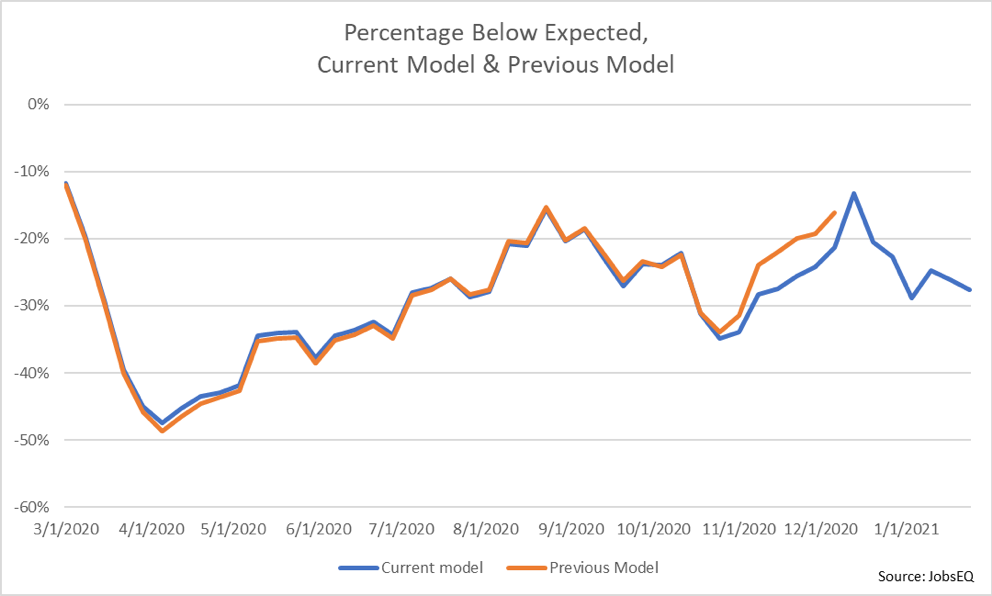
Overall, the recovery model shows little change in relative job ad volume at the beginning of 2021. As noted in the previous blog, the recovery appears to have largely stalled, and this trend appears to have continued through the first month of 2021. In fact, over the past five weeks, from the week beginning December 27, 2020 through the week beginning January 17, 2021, job ad volume averaged 25% below expectations, the same percentage as the average below expected for the final 4 months of 2020.
While most changes due to the source data update were small, the most significant difference is that recovery in ad volume was revised to be slower in late Fall 2020 than previously estimated. After hitting a seasonal low of 34% below expected volume in the final week of October, observed volume increased dramatically relative to expected. Per the updated data, volume reached 21% below expected on the week on December 6. During the five-week span from the week of November 1 through the week of December 6, the difference between observed and expected volume with the revised data is roughly 5% lower than the difference in the previous estimates over the same period.
Below is a chart showing the percentage below expected volume for both the current RTI classification along with the previous model.

[1] While RTI data are updated daily, a full rerun of historical data to fully incorporate underlying model updates and revisions occurs approximately twice yearly. Underlying models include the classification of ads into relevant data points, such as SOC codes and skill identification, along with the deduplicating process. Sources are added and removed on an ongoing basis and may be more prominent during the full update process.


