There are two alternative ways to measure the size of an economy: Gross Domestic Product (GDP) and Gross Domestic Income (GDI). In theory, GDP should always equal GDI. In practice, the two measures never match.
Data
Forecasting
Economy
JobsEQ
Trends
Analysis
Consulting
Plus
Pro
By Francesco Renna
Published Jun 13, 2023
Key Takeaways:
- There are two alternative ways to measure the size of an economy: Gross Domestic Product (GDP) and Gross Domestic Income (GDI). In theory, GDP should always equal GDI. In practice, the two measures never match.
- GDP fell for two consecutive quarters in the first half of 2022, but GDI fell only in the second quarter of 2022. A technical recession is defined by many countries around the world as two consecutive quarters of decline in GDP. [1]
- The situation has reversed in recent months. GDI fell in the last quarter of 2022 and in the first quarter of 2023, while the GDP increased during the same period.
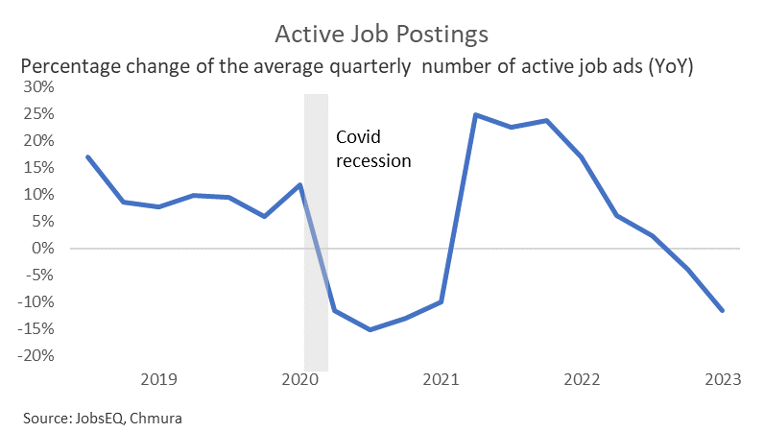
- Active Job Postings are more strongly correlated with GDI (correlation coefficient: 82.5) than with GDP (correlation coefficient: 76.8)
The Bureau of Economic Analysis (BEA) produces two alternative measures intended to track the size of the U.S. economy: Gross Domestic Product (GDP) and Gross Domestic Income (GDI). GDP, which was the subject of a previous blog, is more commonly cited than its sibling, but GDI deserved some attention too. Both measures quantify the output produced within an economy but from different points of view. Think of a cake that you may buy from a local bakery. One way to quantify its value is to simply read the price when you scan the product at the cash register. That is the approach used to compute GDP. Alternatively, one can sum up the remuneration for all the inputs used in making the cake (labor, natural resources, and capital) including the bakery’s profit. This is the approach used when computing the GDI.[2]
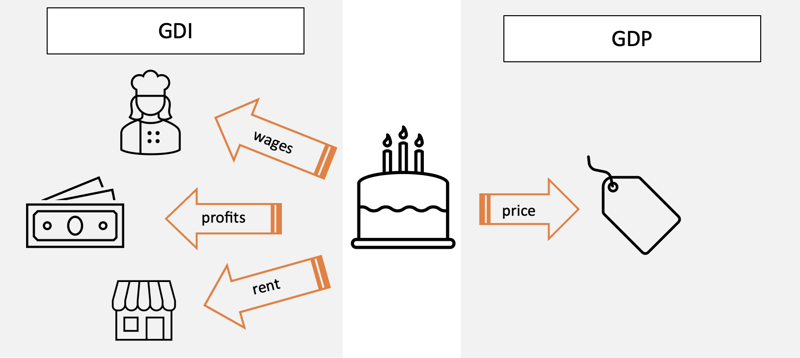
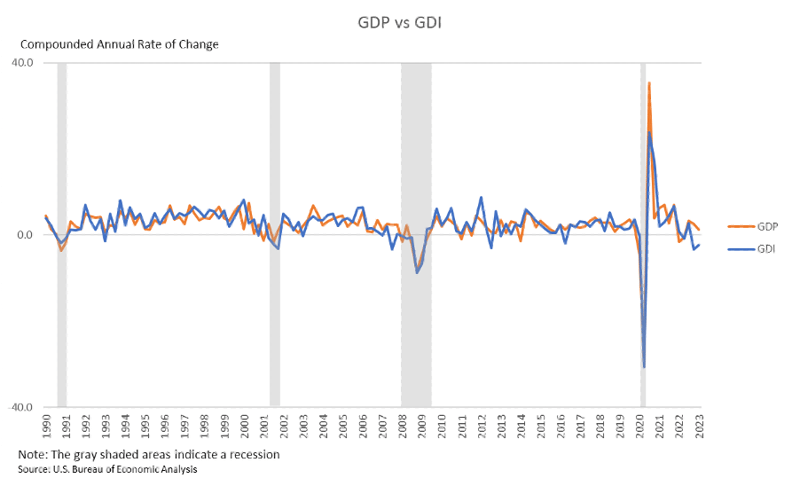
In theory, the price consumers pay for the cake should match the salary, rent, interests, and profits paid to make that cake.[3] In practice, GDP doesn’t always match GDI because the BEA collects data using different sources. The difference between the two measures is referred to as “statistical discrepancy.” Even if the two measures never perfectly match, they tend to move together over time. In recent quarters, though, their behavior has painted a diverging picture of the U.S. economy.
In the first two quarters of 2022, GDP declined an annualized 1.9% and 0.06%, respectively, raising some concerns about the economy entering a recession. Two consecutive quarters of negative GDP growth are associated with a “technical recession,” which is not the same as an official recession. An official recession is called by the NBER’s Business Cycle Dating Committee, which takes into consideration a variety of factors such as real personal income, nonfarm payroll employment, real personal consumption expenditures, wholesale-retail sales, employment as measured by the household survey, and industrial production. The Covid recession lasted less than two quarters, but it was still designated as a recession given the severity of the downturn.
It can take longer than a year for the NBER’s Business Cycle Committee to call a recession. The BEA periodically revises the estimates of key economic indicators using more accurate data and the committee prefers to wait for the most accurate measures before pronouncing a recession. It is unlikely that the contraction in the first half of 2022 will be called a recession. While GDP dropped for two consecutive quarters at the beginning of 2022, GDI entered negative territory only in the second quarter of 2022. Industrial production and employment remained strong in the first half of 2022 despite the decline in GDP. Real personal income (less transfers) also declined, but did not lead to a drop in personal consumption expenditure.
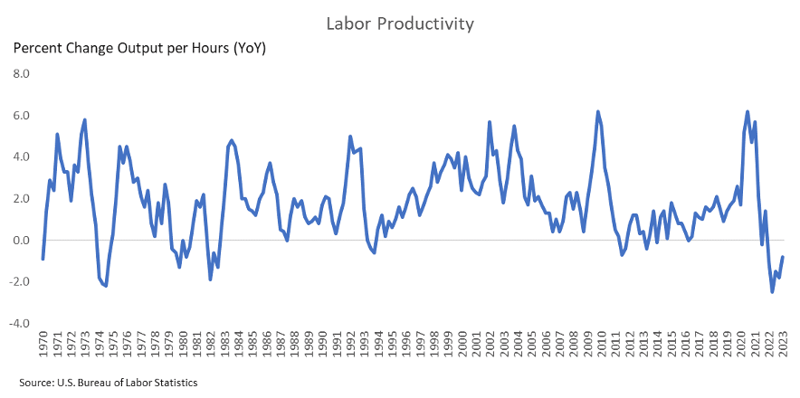
The situation has reversed in recent quarters. Real GDP has grown at an annualized rate of 2.6% in the last quarter of 2022 and then again at 1.3% in the first quarter of 2023, beating many analysts expectations. GDI instead dropped by an annualized 3.3% in the last quarter of 2022 and again by an annualized 2.3% in the first quarter of 2023. These drops are similar in magnitude to the GDI decline we witnessed during the recession of the early 1990s and the recession in 2001. Industrial production has also decreased since the last quarter of 2022. While unemployment remains low, productivity is down to levels we have not seen since the early 1980s, which explains why output is declining without a corresponding slump in employment.[4]
Another metric that is telling the same story portrayed by GDI is Chmura’s JobsEQ RTI job posting data.[5] After peaking in mid-2022, the number of active job ads has been steadily declining. The average number of active job postings in the first quarter of 2023 was down almost 12% compared to a year earlier. Interestingly we find that, although the number of active job postings is strongly correlated with both GDP and GDI, the correlation is higher with the latter (correlation coefficient: 82.52%) than with the former (correlation coefficient: 76.82). Therefore, Chmura’s RTI data is a good indicator of contractions and expansions in GDI. Given that GDI is published with considerable lags, having access to real-time data can be useful to researchers and practitioners to gauge the current status of the economy.
Which measures provide a better representation of the national economy is a question of ongoing debate. The GDP is more frequently cited, probably because it is released earlier than GDI. The BEA considers GDP more reliable because it is based on timelier, more expansive data. But some economists believe that GDI does a better job of capturing the cyclicality of output during expansions and contractions. [6]
--------------------------------------------
[1] The National Bureau of Economic Research (NBER) is the arbiter of recession in the United States. In addition to quarterly GDP, they consider other monthly indicators such as employment, real consumer spending, and industrial production to define when a recession starts and ends.
[2] In the example, the baker also uses intermediary commodities such as flour and sugar. However, these too are a function of labor, natural resources, and capital. In the end, any input used in the production of a cake can be reduced to the wages, interests, rents, and profits paid to produce each intermediate good.
[3] There are some inherent differences in the due measures due to taxes and depreciation.
[4] These series undergo periodic revisions as more accurate data is collected. The current gap may more closely align with future revisions.
[5] For more information on our RTI job posting data, please contact one of our sales team representatives at www.chmura.com
[6] Nalewaik, J. J., Diebold, F. X., & Landfeld, J. S. (2010). The Income- and Expenditure-Side Estimates of U.S. Output Growth [with Comments and Discussion]. Brookings Papers on Economic Activity, 71–127


