A company grading themself on staffing diversity needs to pick the proper benchmark.
Workforce
Data
Economy
JobsEQ
Trends
Analysis
Consulting
Staffing
By Chmura Economics & Analytics
Published Sep 8, 2022
A company grading themself on staffing diversity needs to pick the proper benchmark. There are a variety of available labor market data related to diversity and choosing the wrong data could easily result in the wrong conclusion.
This issue is illustrated below through examples that focus on race, but similar examples can also be generated for gender, ethnicity, or age. The scenarios shown here identify several of the variables that affect the baseline expectations.
Regional Occupation Demographics
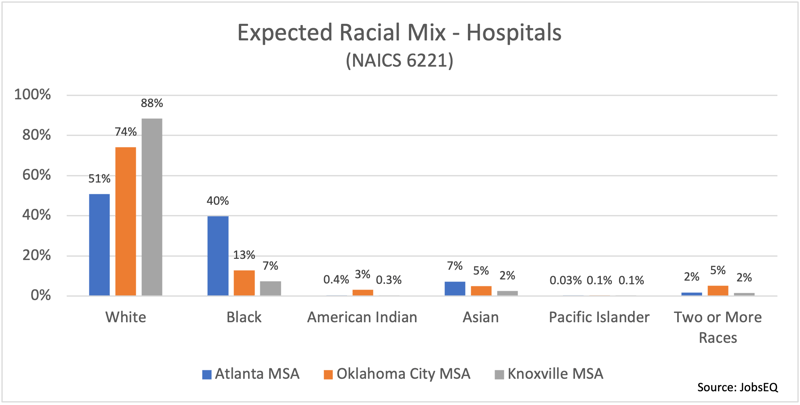
The first variable to take into account is the region of analysis. The example baseline above is for companies in the industry, General Medical and Surgical Hospitals (NAICS 6221).[1] These expectations are based on the race mix of workers by occupation and the typical occupation staffing patterns in this industry. These race patterns are region specific, which is the aspect that drives the differences in this example. Demographics of the population varies by market area, and these demographics play out in the workforce available to employers in those respective regions. Hospitals in Atlanta and Knoxville, therefore, will be expected to have different racial make-ups.
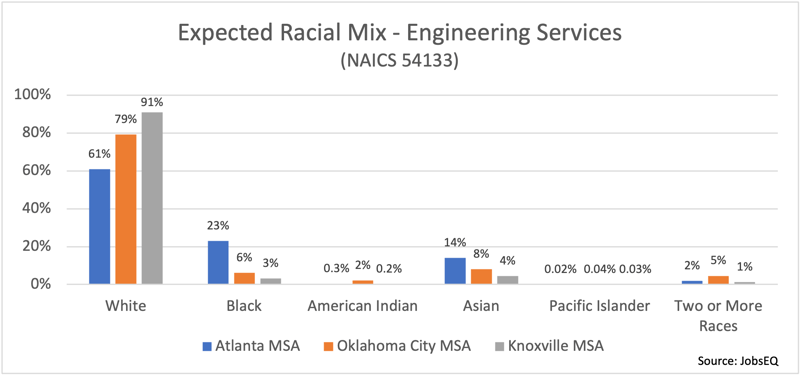
The next variable is the industry, which will impact the occupation mix. The above chart illustrates the baseline for the same three market areas as before, but this time for companies in the industry of Engineering Services (NAICS 54133). The variations by region appear in this example again, however, there is additional variation between this industry and the health care example. These industries employ different occupations, and occupations can have different demographic make-ups; see this Bureau of Labor Statistics (BLS) table for examples. Because of occupational differences and staffing pattern differences, the expected demographic mix varies at the industry level.
Completions Demographics
To be clear, citing these demographic differences by occupation is not meant to suggest that these variations are an acceptable status quo. Some employers will certainly be looking to be part of a vanguard of change towards improved diversity at the occupational level. Towards this effort, a valuable additional data source is postsecondary completions data.[2]
As an example of the value of these data, let’s consider the chemical engineering occupation. Based on BLS occupation data for 2021, 1.3% of chemical engineers employed in the United States were Black—quite lower than the 12.3% of Black workforce overall.[3] Since this occupation relies on postsecondary graduates for supply, completions data offer an insight into the demographic mix of workers available for moving into this occupation to displace workers moving to other jobs or moving out of the workforce, such as through retirement.
In the 2020-2021 academic year, 3.7% of awards in programs related to the chemical engineering occupation were earned by Black students. This suggests the potential to increase the 1.3% overall mix for this occupation in the United States. There are still other variables, however, that can impact the mix of the job applicant pool for this occupation, even among recent graduates. In the 2020-2021 academic year, Black students earned 4.3% of all bachelor’s degrees related to chemical engineering, but only 1.9% of all master’s degrees. The demographic mix of graduates also varies greatly by region—in the same academic year, for example, Black students accounted for 10.6% of chemical engineering award earners in the Maryland-DC-Virginia region, but just 2.3% in Illinois, and even lower percentages in Minnesota (1.0%) and Wisconsin (0.0%).
Other Data Possibilities
The above data can all be found in JobsEQ, Chmura’s labor market software tool. There are decided advantages of these specific data—mentioned below—but if you don’t have access to such a tool, there are other optional benchmarks, though important limitations should be noted.
The U.S. Census Bureau publishes population data demographics at a variety of regional levels. These data can provide a high-level comparison of demographic differences between two geographies, but it doesn’t match workforce expectations, especially for specific jobs. The Census Bureau also publishes labor force demographics, that is, diversity data specific to the overall employed and unemployed in a geography. The drawback here, however, is that this still will not capture job-specific demographic variations.
The Quarterly Workforce Indicators, however, is another Census Bureau data set and one that provides more detailed analysis. Here you can find industry-specific diversity data. These data can be queried at the 4-digit NAICS level and for counties and metropolitan areas. There are some limitations, however, such as not being able to query custom regions or more detailed industries. Also, data may be unavailable for certain region-industry combinations.
The JobsEQ occupation-based diversity data, on the other hand, do not have these limitations and can be queried in a way to improve accuracy. These data can be examined for any type of region, even customizable regions such as a drive-time, which can provide a more precise model of a company’s labor shed. These differences can be very dramatic, even within the same market area. For example, consider two cities within the Atlanta metro area, Senoia and Jasper; the racial mix of Black licensed practical nurses living within a 40-minute drive-time labor shed[4] around each city varies by as much as fifty percentage points from one region to the next. Another advantage is that custom staffing patterns can be used with the JobsEQ data set, enabling a company to get a more precise benchmark on based on their specific talent mix, rather than using an industry average staffing pattern that may not be reflective of their unique company profile. Furthermore, an employer can even use these custom staffing patterns to isolate and analyze diversity at the departmental level.
Please reach out to us if you’d like to learn more about JobsEQ or to talk with our economists about your diversity project.
-----------
[1] The North American Industry Classification System is used to define industries in this article; see https://www.census.gov/naics/ for more information.
[2] See https://nces.ed.gov/ipeds/use-the-data/survey-components/7/completions for further details on these data.
[3] https://www.bls.gov/cps/cpsaat11.htm
[4] These labor sheds were defined as the collection of zip codes within the specified drive-times.


