You go to look up employment in an industry for one of your largest employers, but instead of a number you find (ND), or maybe the industry is just...
Data
JobsEQ
By Patrick Clapp
Published Oct 31, 2019
You go to look up employment in an industry for one of your largest employers, but instead of a number you find (ND), or maybe the industry is just not shown at all. What does that mean, and why aren’t some data available?
“ND” (or “n.d.” or similar variations) in data from the Bureau of Labor Statistics (BLS) indicates that those data are Not Disclosable. The data have been collected; however, they have been suppressed in public releases.
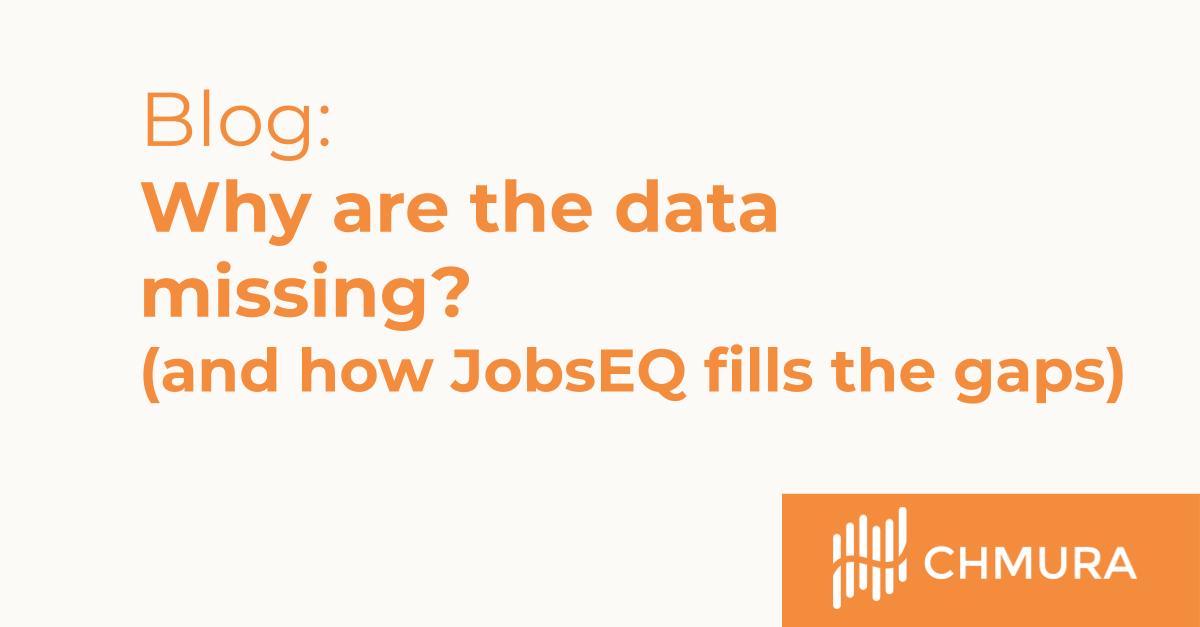
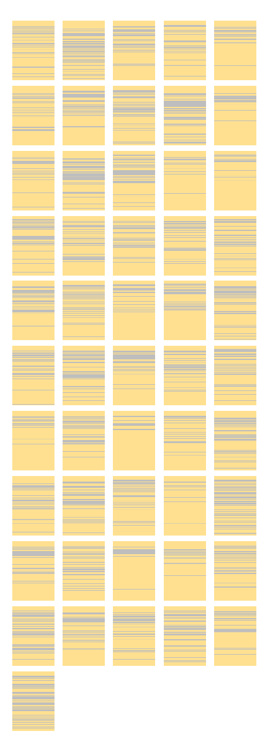
How much data are affected and how could it impact your analysis? The image shown here gives a snapshot of Quarterly Census of Employment and Wages (QCEW) data for every state at the state level. Each line represents a row of data and an industry at various levels of detail. Yellow lines indicate data are available while blue lines show suppressions.
You are more likely to run into data which cannot be disclosed when looking for more detailed information, for cases such as a small geography or an industry with only a handful of employers. You’ll also find suppression when there is a single large employer that dominates a regional industry.
The primary rule the BLS uses for whether or not to disclose data is when one of the following is true:
- There are fewer than three establishments in an industry for a certain geography, or
- One employer accounts for more than 80% of all employment in an industry in the area.[1]
In addition, data may not be released if it would violate a state’s disclosure rules. Further, data is not disclosed if it could be used to calculate another suppressed data point.
If data are not disclosed because there are fewer than three establishments, the impact on the data user may be small as the involved employment may likewise be low. However, missing data due to a large employer that dominates regional employment could significantly skew total employment numbers.
Chmura’s JobsEQ fills in these gaps in the data. Estimates are made from combining many other data sources for reliable information, with modeling backed by our team of economists, statisticians, and data scientists to ensure accuracy and reliability at all levels of detail.
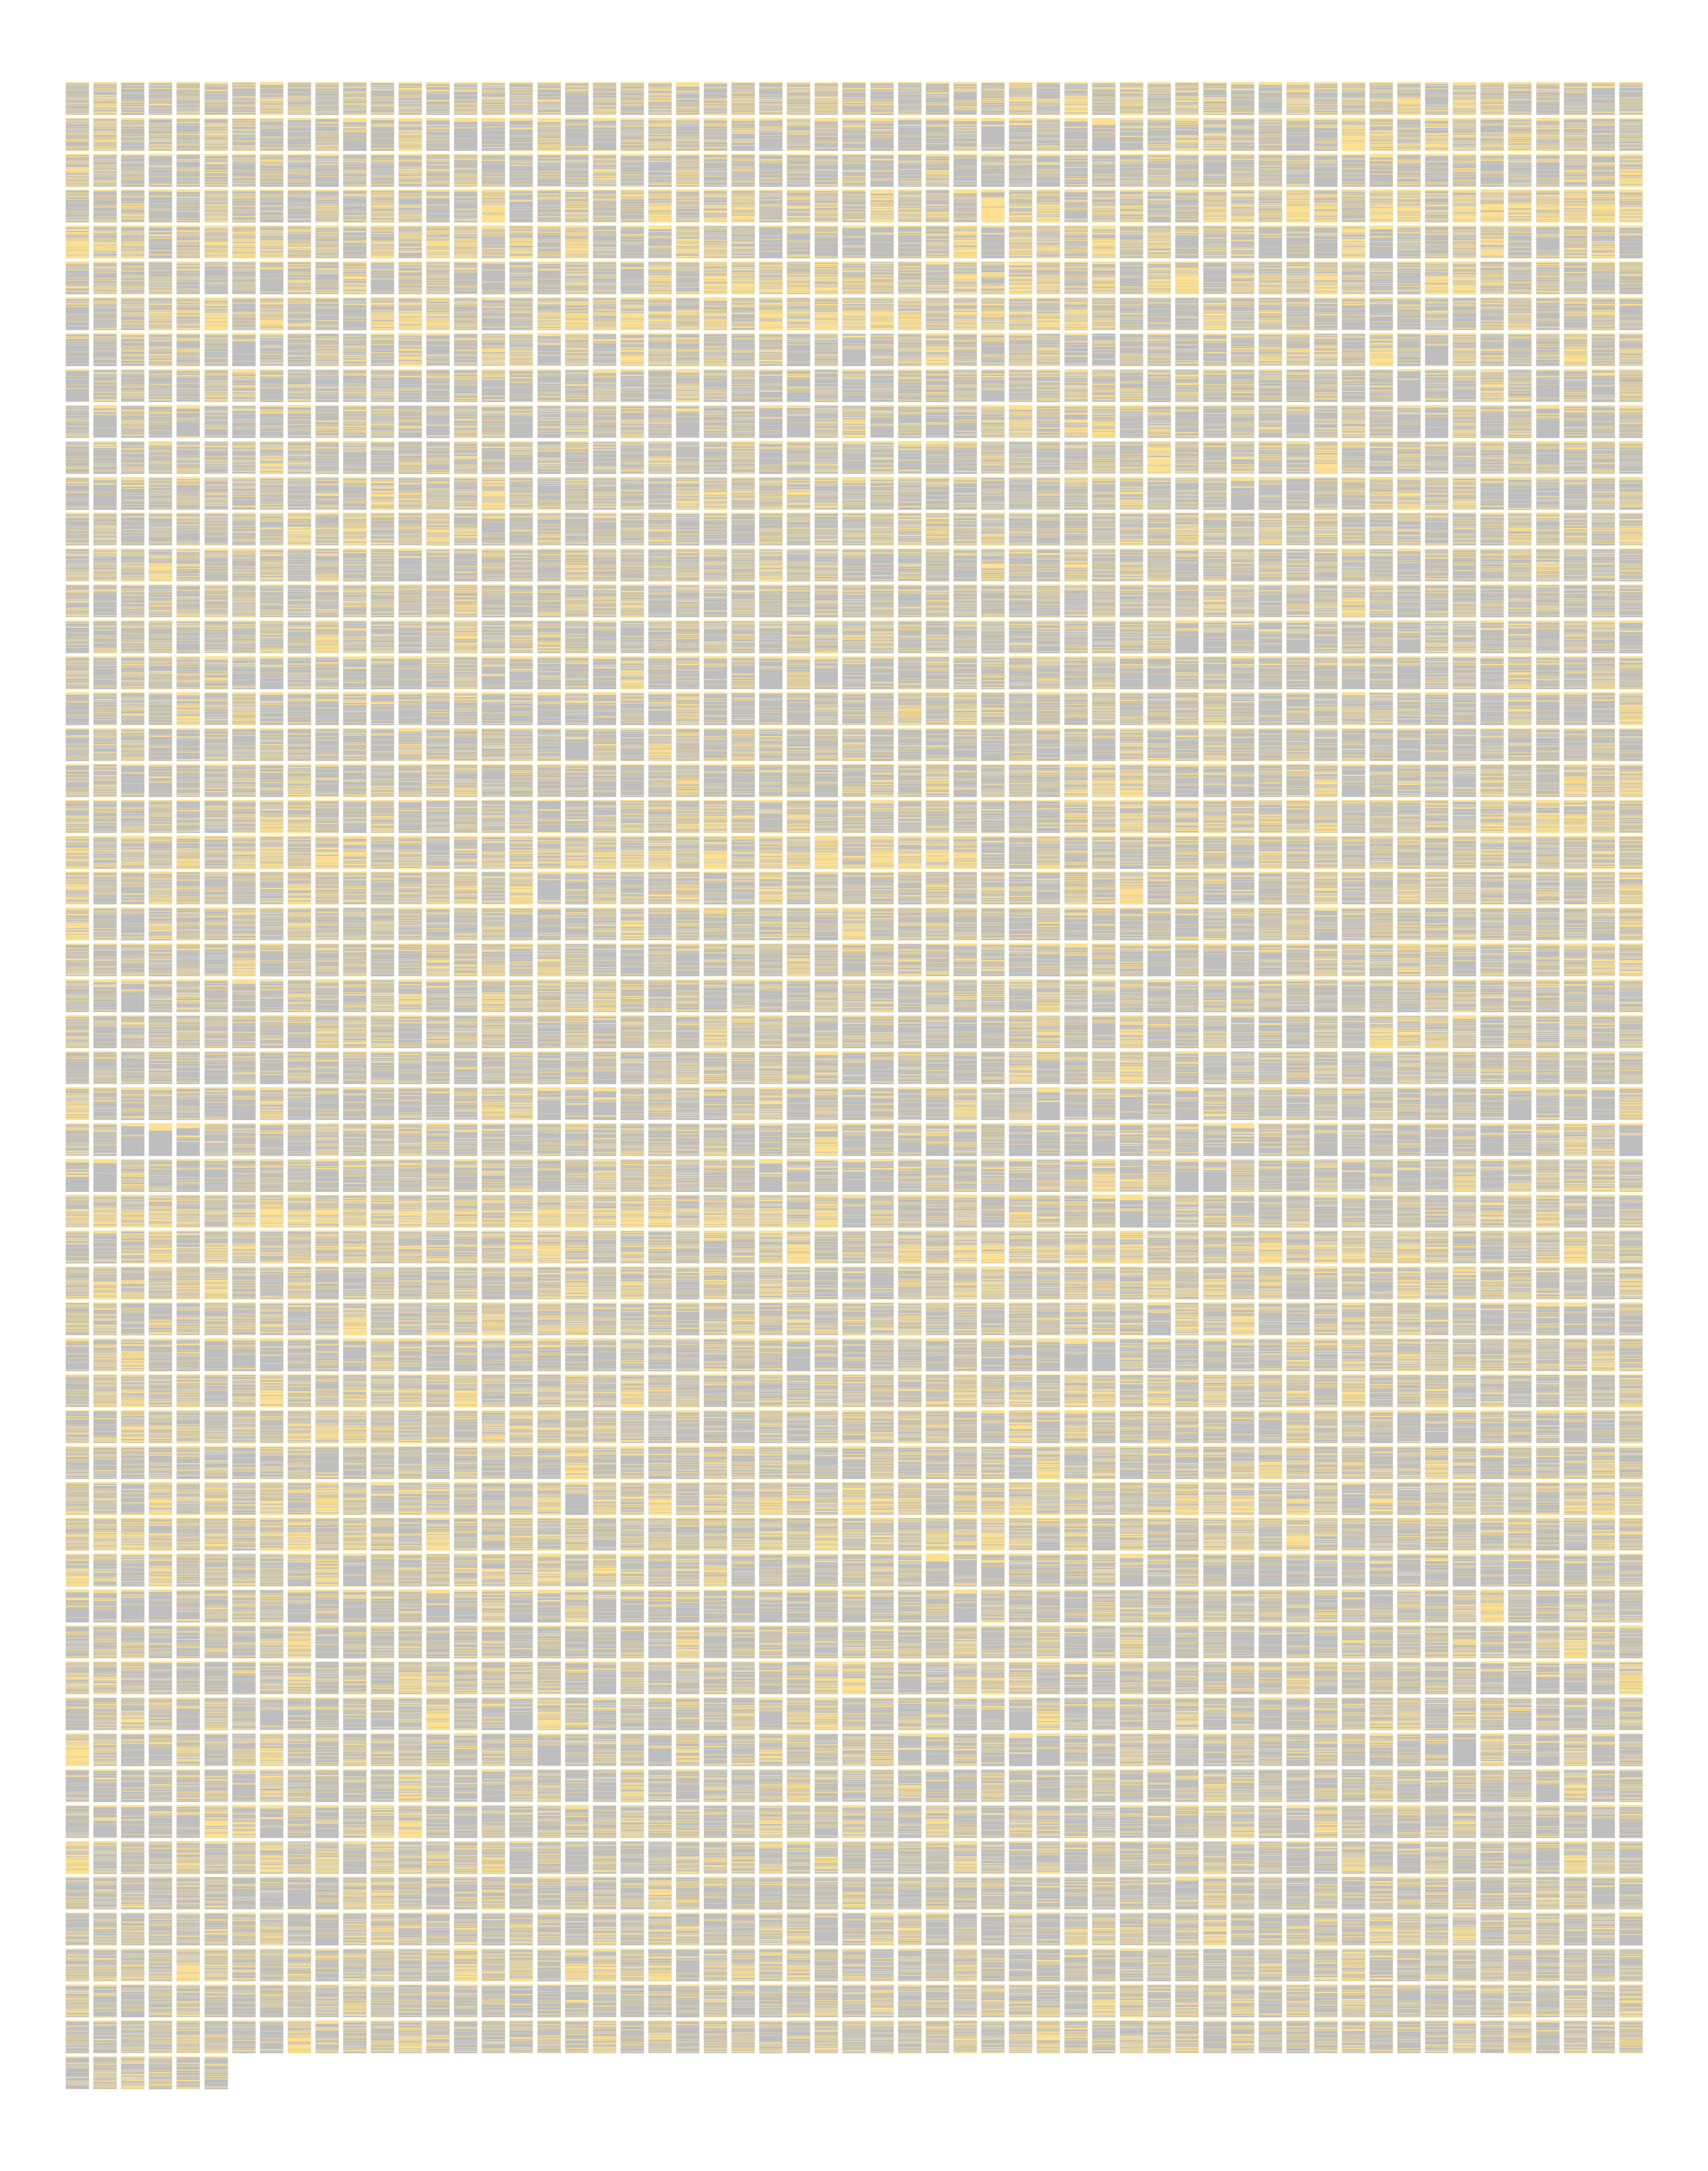
Curious what QCEW looks like at the county level? Just keep scrolling down.
[1] Some states use rules that are more restrictive than the these.


