After a five-month dip, new online job ads surpassed pre-COVID levels in August. Though the lack of demand in higher-wage occupations has continued,...
Workforce
Covid-19
Trends
By Chmura Economics & Analytics
Published Sep 4, 2020
After a five-month dip, new online job ads surpassed pre-COVID levels in August. Though the lack of demand in higher-wage occupations has continued, this may be tied to fewer separations in recent months.
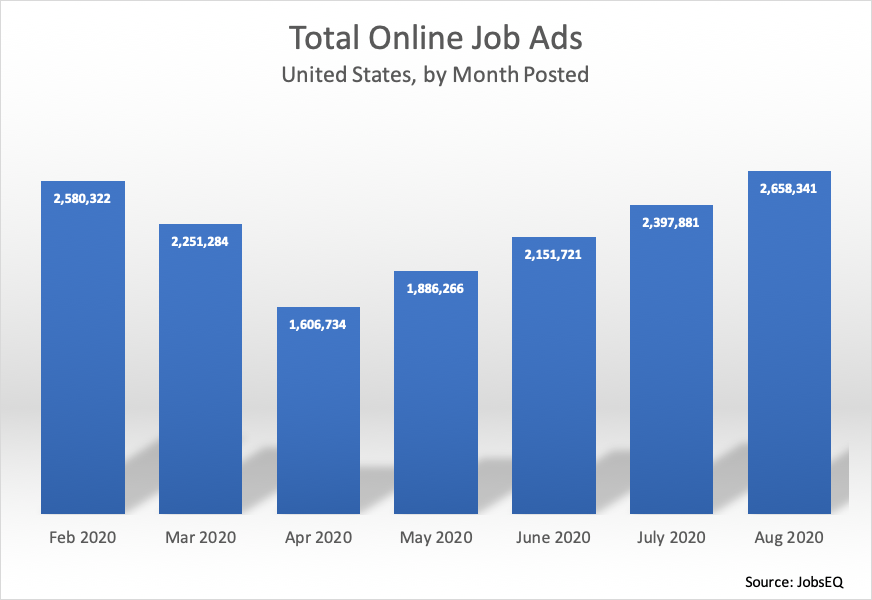
New online job ads eclipsed February levels reaching approximately 2.66 million in August compared to 2.58 million in February. Volume hit a trough of 1.61 million in April as large portions of the economy were shut down in reaction to the coronavirus pandemic. New ad volume increased every month since.
Wage Impacts
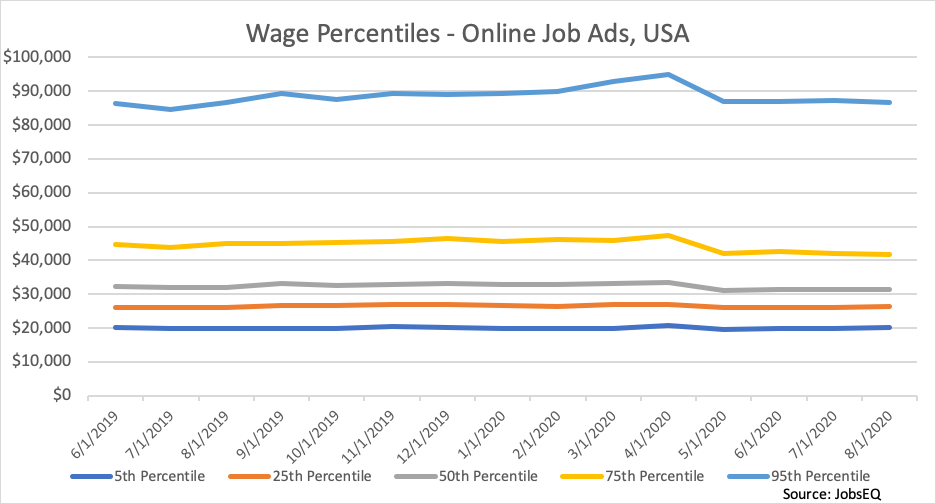
The spread of wages offered in job ads shifted dramatically in the months of March and April as shown in the chart above in a sampling of percentiles. Comparing the period before and after the shift—namely, the four months ending February versus the four months beginning May—wage percentiles declined across the board, from a 1.2% decline in the 5th percentile to a 7.9% drop in the 75th percentile.
This decline in wages, however, has its roots in a change in the mix of jobs being advertised rather than a drop in wages in specific occupations. At the occupation level (the 8-digit SOC level), wages increased an average 1.5% in comparing the same four-month periods before and following the months of March and April.[1] This type of wage increase, incidentally, is not far out of line with the typical increase in wages over time during the last ten years.[2]
Variation in Demand by Occupation
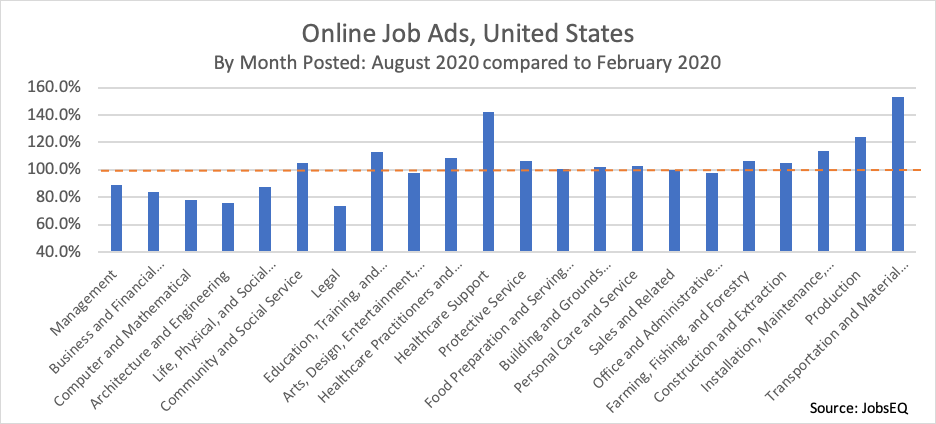
The shift in occupation mix found in online job ads is summarized in the chart above. A number of major occupation groups saw more ads in August as compared to February, with the largest increases in transportation and material moving, healthcare support, and production occupations—groups with generally lower-than-average wages. On the other hand, a number of higher-wage occupation groups in August lagged significantly below February levels, including: legal, architecture and engineering, computer and mathematical, business and financial operations, and management occupations.
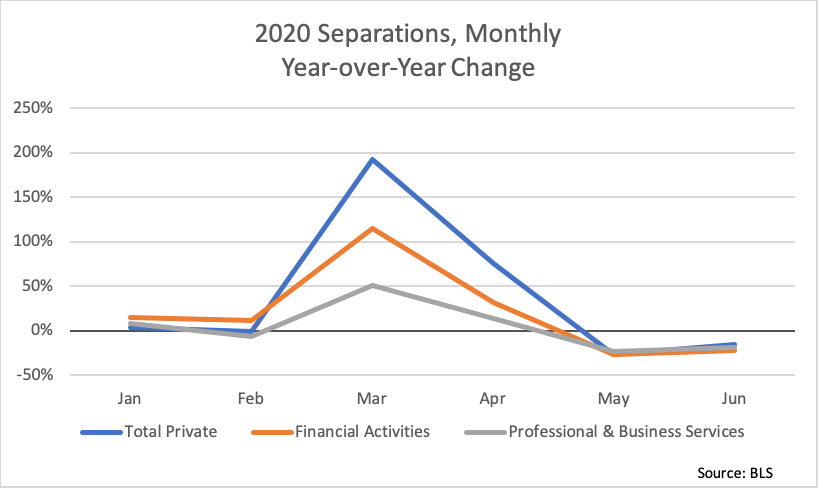
The dampened number of job ads in these higher-wage occupations is somewhat in-line with a decline in separations following the March and April disruption. Per the BLS JOLTS data, following the spike due to COVID, job separations (including quits, layoffs and discharges, and other separations such as retirements) were lower in May and June 2020 compared to the same months in 2019. In the sectors of professional and business services and financial activities, the separation rates in May and June were in the neighborhood of 1/5 lower than a year earlier. This difference roughly lines up with the shortfall in online job ads for a number of the high-wage occupation groups, implying that the dampened demand for new workers in these positions is at least partially driven by a lack of separations in these occupations in the post-COVID period.
The question may arise: why is this separations effect manifest in these higher-wage occupation groups but absent in the lower-wage groups highlighted above? At least in part, these occupation groups are tied to industries that did not have the same dramatic decline in separations. The transportation, warehousing, and utilities sector did not see a year-over-year drop in separations in May and June, but rather posted an increase. Manufacturing also had an increase in separations in June. The health care and social services sector had declines in separations, but at a lower-than-average rate.[3]
About the Data
All job postings data above are derived from JobsEQ, the Real-Time Intelligence online job ad data set, pulled from over 30,000 websites and updated daily. Historical volume is revised as additional data are made available and processed. Each month of ads is defined as new online ads that first appeared in that month. All ad counts represent deduplicated figures. The relationship between ad counts and actual hires is described here.
Many extraneous factors can affect short-term volume of online job postings. Thus, while the changes noted above should be watched over time to confirm the impacts, such a short-term snapshot can offer an early indication of labor market shifts, especially valuable in this time of unprecedented economic disruption.
[1] Specifically, this was the average increase in wages calculated for all 8-digit occupations where each occupation had a minimum of 200 ads with disclosed wages over the period of analysis. Wages used in the analysis here were those solely taken from ads that explicitly included wages.
[2] For example, the cost per hour worked averaged a 2.4% annualized increase over the last ten years (per the BLS Employment Cost Trends).
[3] All separations data per the Job Openings and Labor Turnover Survey, preliminary data through June 2020.