Recently, Chmura released the COVID-19 Economic Vulnerability Index , a measurement of the negative impact the COVID-19 pandemic may have on...
Economic Development
Workforce
Covid-19
By James Stinchcomb
Published Apr 17, 2020
Recently, Chmura released the COVID-19 Economic Vulnerability Index, a measurement of the negative impact the COVID-19 pandemic may have on employment in a region. The Vulnerability Index is based on a region’s industry mix and how dependent a region’s economy is on highly vulnerable industries. For example, accommodation and food service industries are projected to lose many more jobs than professional services industries, so a region whose industry mix leans heavily towards accommodation and food service, such as Las Vegas (Vulnerability Index of 178.9), will have a higher index compared to a region that is much more dependent on professional service industries, like Washington DC (85.9). One important caveat to the Vulnerability Index is that while it measures the potential negative employment impact, it does so through the employment mix, and does not take in to account the infection rate in a region or the local government’s response to the pandemic, both of which will also have an effect on the ultimate economic impact.
In previous blogs we examined the potential economic impact of the COVID-19 pandemic by looking at changes in online job ad volume, using JobsEQ RTI data. With these data we have demonstrated evidence for how certain industries are more heavily impacted by the pandemic, that the government response plays a large role in the impact, and that the infection rate is also contributing to the impact. In this blog, we are looking at the twenty-five largest metropolitan areas (MSAs) in the United States and comparing the trends in the RTI data to their Vulnerability Index measure.
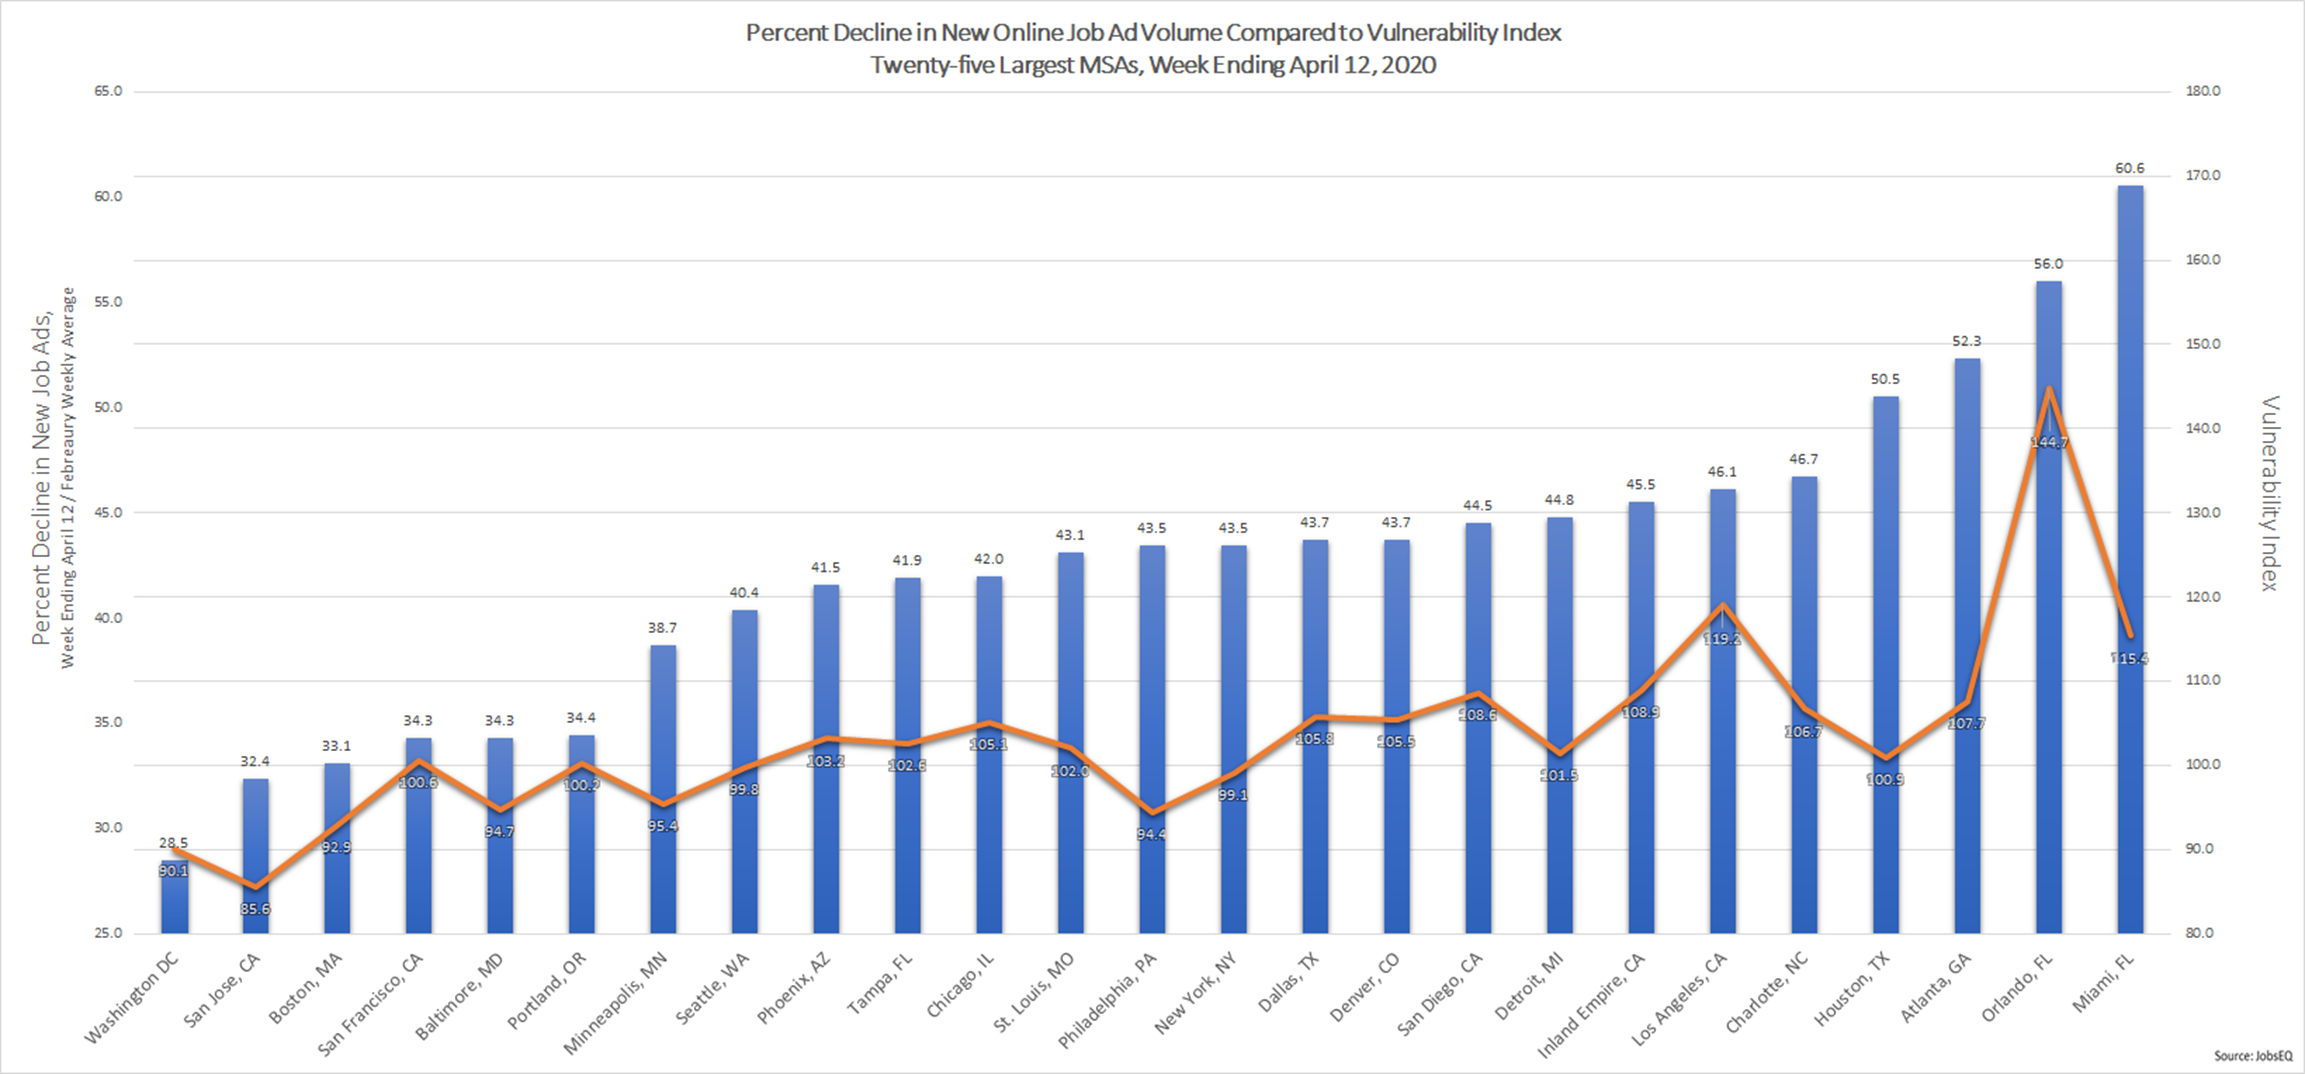
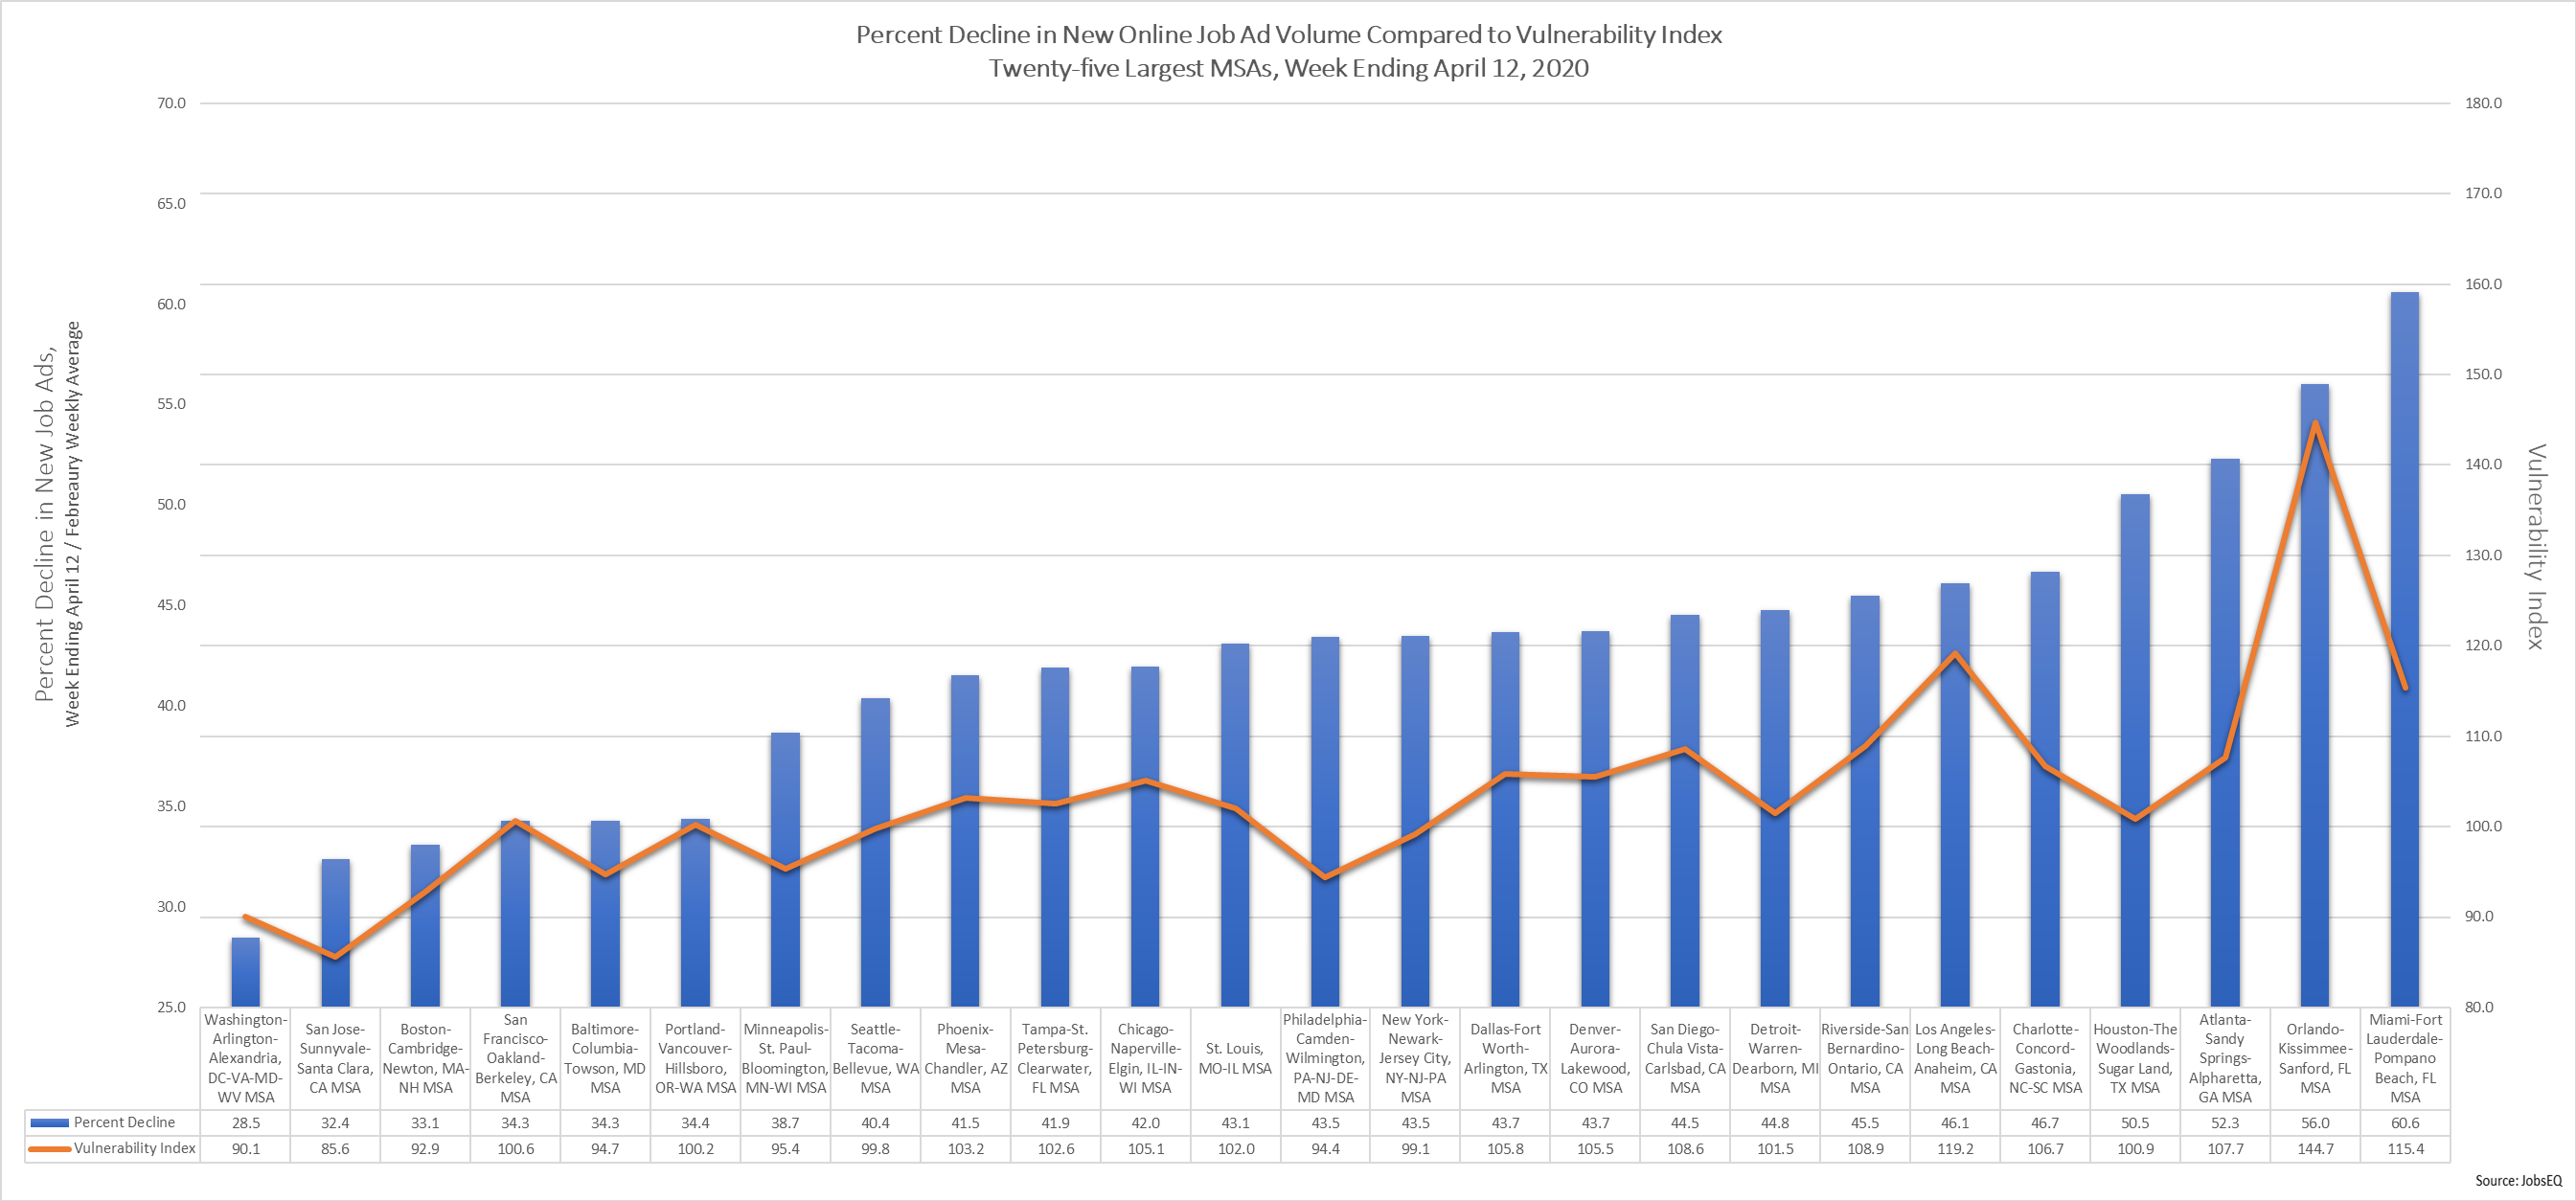
The chart above shows the decline in new online job ad volume for the week ending April 12 from the average weekly volume for the month of February (blue bars) along with Vulnerability Index score (orange line) for each MSA.[1] Overall, the decline in job ad volume follows the Vulnerability Index very closely, with the three MSAs experiencing the lowest decline in volume (Washington-Arlington-Alexandria, DC-VA-MD-WV, San Jose-Sunnyvale-Santa Clara, CA, and Boston-Cambridge-Newton, MA-NH) also being the three with the lowest Vulnerability Index score. At the high end of the volume drop, Miami-Fort Lauderdale-Pompano Beach, FL and Orlando-Kissimmee-Sanford, FL experienced the largest decline in volume while having the third and first highest Vulnerability Index score, respectively.
With this chart we also see how other factors, such as infection rate, are playing into the impact. Orlando has by far the highest Vulnerability Index score of this group of MSAs but experienced a smaller decline in job ad volume than Miami. A likely explanation for this is the different infection rates in the two regions as Miami has been hit much harder than Orlando by the virus. Miami has a little more than twice the employment of Orlando (2.9 million in Miami to 1.4 million in Orlando), but according to data from Johns Hopkins University[2] has almost 7 times more infections and 12 times more deaths (13,431 infections and 374 deaths in Miami to 1,940 infections and 31 deaths in Orlando). The large difference in infection rate for each region is likely contributing to the larger decline in job ad volume despite the lower Vulnerability Index score.
Both Chmura’s Vulnerability Index and JobsEQ RTI online job ads data are incredibly useful tools for a region to use in understanding the potential economic impact of the COVID-19 pandemic. The Vulnerability Index provides an immediate gauge on how susceptible a region’s economy is to the shocks caused by the pandemic while the RTI data allows the region to see in real time the impact on job ads and employment.
[1] RTI Data pulled Wednesday, April 15, 2020. Vulnerability Index as of Thursday April 16, 2020.
[2] https://coronavirus.jhu.edu/map.html infection and death data pulled Thursday April 16, 2020 3:40pm.