Get practical insight into prime-age labor force participation and how it helps clarify workforce supply across local labor markets.

By Chmura Economics & Analytics
Published Jun 24, 2026
Key Takeaways
-
Prime-age labor force participation gives a clearer read on core working-age labor supply than an all-age rate alone.
-
Low overall participation can reflect local age structure, especially in regions with large retiree populations.
-
The strongest workforce recommendations connect participation data to hiring plans, funding cases, program alignment, or regional strategy
Prime-age labor force participation helps you judge how much of a region’s core working-age population is truly active in the labor market. The latest Bureau of Labor Statistics data shows why this view matters: the U.S. labor force participation rate for ages 25 to 54 was 83.9% in May 2026, while the total civilian participation rate was 61.8%.
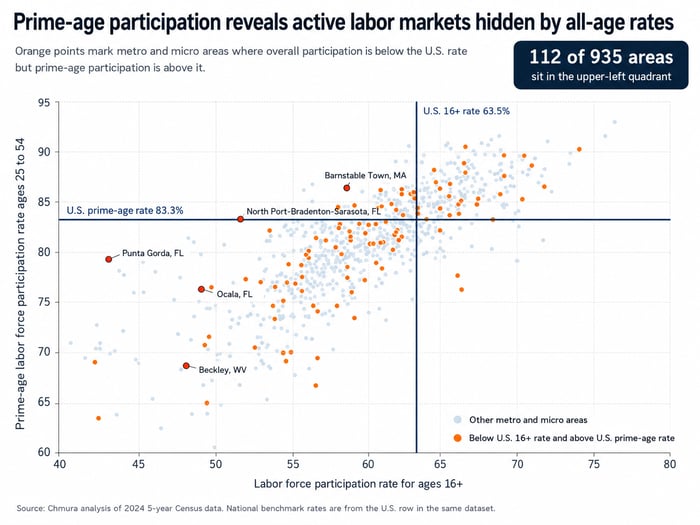
That gap means a single all-age rate can make a labor market look weaker than it really is for hiring, workforce planning, grant support, or education alignment. Chmura’s analysis of 2024 five-year Census data found 112 of 935 metro and micro areas had below-national 16+ participation but above-national prime-age participation, a pattern that can materially change how local labor supply is interpreted.
Prime-age participation shows who is most attached to work
Prime-age participation measures how actively people ages 25 to 54 are working or looking for work. This age range removes much of the noise created by students, retirees, and older workers with partial labor force attachment, giving you a clearer view of the population most likely to support near-term hiring.
A regional workforce board preparing a labor market brief could see a low overall participation rate and assume employers face a shallow labor pool. A prime-age view could show that the region’s core working-age residents remain strongly attached to work. That difference matters when the board must explain worker availability to employers, elected officials, and funders.
The metric does not answer every labor question. It will not tell you whether workers have the right skills, credentials, wages, or commute patterns for a specific role. It does give you a cleaner starting point. Once you know how active the core workforce is, you can add occupation, wage, education, and geography data with less risk of misreading the market.
“Prime-age participation helps keep that answer grounded in the people most likely to fill jobs.”
The rate measures workers most likely to fill jobs
The prime-age rate focuses on people who are most likely to be available for full-time work and most relevant to hiring plans. It gives employers, educators, and economic developers a practical lens for judging labor availability before they build workforce plans or make location-related recommendations.
A corporate workforce planning team comparing two regions for expansion might see similar unemployment rates. Prime-age participation can reveal a sharper difference. One region could have more people actively engaged in work or job search, while another has a larger inactive population that will be harder to reach without training, childcare, transportation, or wage changes.
Use this metric as a first screen, not a final answer. A strong prime-age rate will support confidence, but it still needs to be paired with occupation supply, hiring pressure, commuting data, and wages. A low rate should not end the conversation either. It should push the analysis toward barriers that keep core working-age adults out of the labor force.
Overall participation can hide active local worker pools
Overall participation includes everyone age 16 and older, so it reflects retirees, students, and older workers alongside core working-age adults. That broader view is useful for the macroeconomic context, but it can understate labor strength in regions with older populations or large student shares.
The supplied Census analysis shows how easily this can happen. Areas such as Barnstable Town, Massachusetts, and North Port-Bradenton-Sarasota, Florida, had low 16+ participation but strong prime-age participation. A surface-level read could label those markets weak. A more careful read shows that many core working-age residents are still active in the labor market.
|
What you compare |
What it helps clarify |
|
Overall participation |
This shows how much of the full adult population is attached to work. |
|
Prime-age participation |
This shows how active the core working-age population is. |
|
Local age structure |
This explains why an older region can look weaker on an all-age rate. |
|
Occupation supply |
This shows whether active workers match the roles employers need to fill. |
|
Wage levels |
This helps test whether pay aligns with the available labor pool. |
That distinction is especially important for board reports, grant applications, and site selection work. Stakeholders often want a clear answer about labor availability. Prime-age participation helps keep that answer grounded in the people most likely to fill jobs.
Compare prime-age rates before judging labor availability
Prime-age participation should be compared before a region is labeled tight, weak, or underused. A low all-age rate can reflect demographics more than labor market failure, while a low prime-age rate points more directly to participation barriers among working-age adults.
The Bureau of Labor Statistics projects total participation for people 16 and older to fall from 62.6% in 2024 to 61.1% in 2034, while the rate for ages 25 to 54 is projected to move from 83.6% to 82.8% over the same period. Aging alone will keep pressure on the overall rate, which makes the prime-age lens more useful for local comparisons.
A practical review should check:
- How the local 16+ rate compares with the national rate
- How the local prime-age rate compares with the national rate
- How large the gap is between the two rates
- Which age groups are pulling the overall rate down
- Which local barriers could explain weak prime-age attachment
This sequence keeps the analysis fair. It also helps you avoid overstating labor scarcity when the core workforce remains active.
“A training program will not solve a wage problem.”
Local age structure can distort workforce supply signals
Age structure can make a healthy working-age labor market look weaker than it is. Regions with many retirees will often post lower all-age participation because a larger share of residents is outside the typical working years, even when adults ages 25 to 54 are highly active.
Punta Gorda, Florida, shows this issue clearly in the supplied data. Its overall 16+ participation rate was 43.2%, while its calculated prime-age participation rate was 79.45%. That wide gap does not mean every hiring challenge disappears. It does mean the all-age number alone would give a poor read of the region’s core workforce.
This is where local workforce analysis needs discipline. Retirement-heavy regions can still face serious hiring constraints, especially in health care, skilled trades, hospitality, and public services. The right question is more precise: how many prime-age workers are active, which occupations they work in, what wages they require, and how far they will commute. Better questions lead to better workforce plans.
Strong prime-age participation can support hiring confidence
A strong prime-age rate signals that the core working-age population is already engaged in work or job search. That can support hiring confidence, especially when it aligns with occupation supply, wage fit, and a reachable labor shed.
A site selection advisor comparing regions could use prime-age participation to separate an older market from a truly inactive one. If a region has a low all-age rate but an above-average prime-age rate, the labor story becomes more balanced. The advisor can explain that the broader population is aging, while the core working-age group still shows meaningful attachment to work.
That framing is useful because hiring confidence depends on evidence that can be defended. A single rate will not satisfy executives or public stakeholders. A layered view will. Prime-age participation, paired with wage trends and occupation-level analysis, helps teams explain why a region deserves further consideration instead of being rejected too early.
Weak prime-age participation points to workforce access barriers

Weak prime-age participation is a stronger warning sign than weak all-age participation because it points to disengagement among people most likely to work. That pattern should prompt deeper analysis into access barriers, job quality, skills, health, transportation, childcare, and wage fit.
A workforce board reviewing a region with low prime-age participation should avoid treating the number as a simple labor shortage label. The rate could reflect workers who left the labor force after repeated job search setbacks. It could also reflect scheduling problems, limited transportation, low wages, or training gaps between local residents and available roles.
The response should match the cause. A training program will not solve a wage problem. A wage adjustment will not solve a transportation gap. A childcare barrier will require a different set of partners than an occupation mismatch. Prime-age participation helps identify where to ask harder questions, and then the rest of the labor market analysis helps decide which actions deserve funding and attention.
Use participation data to defend workforce recommendations
Participation data is most useful when it supports a clear recommendation that stakeholders can understand and test. The goal is not to quote one number. The goal is to explain what that number means for hiring, funding, program planning, business attraction, or workforce reporting.
A strong recommendation connects the metric to the decision at hand. An economic development team can use prime-age participation to show that a region’s low overall rate is partly demographic. An education leader can use it to assess whether program plans align with active workers. A corporate team can use it to judge whether a hiring market deserves deeper wage and occupation analysis.
Chmura fits this work when teams need to move from a question to a defensible answer without getting stuck in disconnected spreadsheets or unclear methodology. The strongest workforce recommendations come from disciplined interpretation: start with the right population, test the local context, connect the findings to a real decision, and explain the tradeoffs clearly enough for stakeholders to trust the result.